
2 Proxies
概述
在 Administration → Proxies 里, 分布式监控可以在Zabbix前端进行配置。
Proxies
显示现有proxy列表及其详细信息
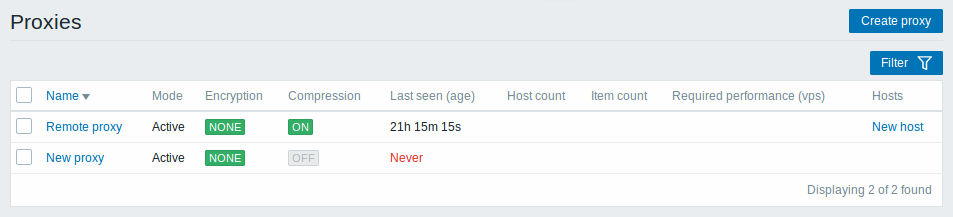
显示的信息:
| Column | 描述 |
|---|---|
| Name | Proxy名称。点击proxy名可以打开当前proxy 配置表单. |
| Mode | 显示Proxy的模式 - Active 或者 Passive. |
| Encryption | 显示来自proxy的连接的加密状态: None - 不加密 PSK -使用PSK方式 Cert -使用证书 |
| Last seen (age) | 显示sever上次看到agent的时间 |
| Host count | 显示被proxy监控的host数量 |
| Item count | 显示被proxy监控的监控项的数量。 |
| Required performance (vps) | 显示所需的proxy性能(每秒需要收集的值的数量)。 |
| Hosts | 列出由proxy监控的所有主机。 单击主机名将打开主机配置表单。 |
配置新的proxy,请单击顶部右上角的 Create proxy 按键。
批量编辑选项
列表下面的按键会提供一些批量编辑选项:
- Enable hosts - 将被proxy监控的host的状态改为 Monitored (监控)
- Disable hosts -将被proxy监控的host的状态改为 Not monitored (不监控)
- Delete - 删除proxy
要使用这些选项,请在各个proxy之前标记复选框,然后单击您需要的按键。
过滤器
因为列表中可能包含许多proxy,所以可能需要通过过滤得到您需要的内容。
Filter过滤器 链接位于agent列表之上。 如果您点击它,则可以使用过滤器,您可以通过名称和模式过滤proxy。

2 Proxies
Overview
In the Administration → Proxies section proxies for distributed monitoring can be configured in the Zabbix frontend.
Proxies
A listing of existing proxies with their details is displayed.
Displayed data:
| Column | Description |
|---|---|
| Name | Name of the proxy. Clicking on the proxy name opens the proxy configuration form. |
| Mode | Proxy mode is displayed - Active or Passive. |
| Encryption | Encryption status for connections from the proxy is displayed: None - no encryption PSK - using pre-shared key Cert - using certificate |
| Last seen (age) | The time when the proxy was last seen by the server is displayed. |
| Host count | The number of enabled hosts assigned to the proxy is displayed. |
| Item count | The number of enabled items on enabled hosts assigned to the proxy is displayed. |
| Required performance (vps) | Required proxy performance is displayed (the number of values that need to be collected per second). |
| Hosts | All hosts monitored by the proxy are listed. Clicking on the host name opens the host configuration form. |
To configure a new proxy, click on the Create proxy button in the top right-hand corner.
Mass editing options
Buttons below the list offer some mass-editing options:
- Enable hosts - change the status of hosts monitored by the proxy to Monitored
- Disable hosts - change the status of hosts monitored by the proxy to Not monitored
- Delete - delete the proxies
To use these options, mark the checkboxes before the respective proxies, then click on the required button.
Filter
As the list may contain many proxies, it may be needed to filter out the ones you really need.
The Filter link is available above the list of proxies. If you click on it, a filter becomes available where you can filter proxies by name and mode.