
8 Debug mode 调试模式
Overview概述
Debug mode may be used to diagnose performance problems with frontend pages.调试模式可用于诊断前端页面的性能问题。
Configuration配置
Debug mode can be activated for individual users who belong to a user group:可为所属用户组的各个用户激活调试模式:
- when configuring a user group;当配置user group时;
- when viewing configured user groups.当查看配置user groups时;
When Debug mode is enabled for a user group, its users will see a Debug button in the lower right corner of the browser window: 当Debug mode 为用户组启用时,其用户将在浏览器窗口的右下角看到 Debug 按钮:

Clicking on the Debug button opens a new window below the page contents which contains the SQL statistics of the page, along with a list of API calls and individual SQL statements:单击 Debug 按钮将在页面内容下方打开一个新窗口,其中包含页面的SQL统计信息,以及API调用和各个SQL语句的列表:
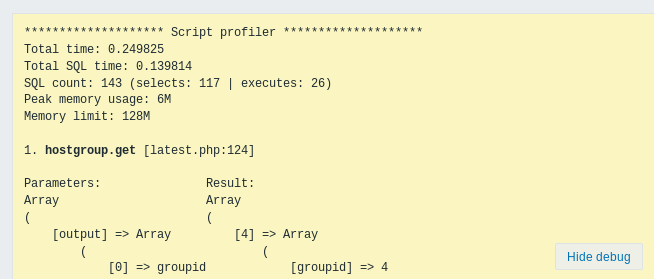
In case of performance problems with the page, this window may be used to search for the root cause of the problem.如果页面出现性能问题,可以使用此窗口搜索问题的根本原因。
Enabled Debug mode negatively affects frontend performance.启用 Debug mode 会对前端造成一定的性能影响。