
13 Remote monitoring of Zabbix stats
Overview
It is possible to make some internal metrics of Zabbix server and proxy accessible remotely by another Zabbix instance or a third-party tool. This can be useful so that supporters/service providers can monitor their client Zabbix servers/proxies remotely or, in organizations where Zabbix is not the main monitoring tool, that Zabbix internal metrics can be monitored by a third-party system in an umbrella-monitoring setup.
Zabbix internal stats are exposed to a configurable set of addresses listed in the new 'StatsAllowedIP' server/proxy parameter. Requests will be accepted only from these addresses.
Items
To configure querying of internal stats on another Zabbix instance, you may use two items:
zabbix[stats,<ip>,<port>]internal item - for direct remote queries of Zabbix server/proxy. <ip> and <port> are used to identify the target instance.zabbix.stats[<ip>,<port>]agent item - for agent-based remote queries of Zabbix server/proxy. <ip> and <port> are used to identify the target instance.
See also: Internal items, Zabbix agent items
The following diagram illustrates the use of either item depending on the context.
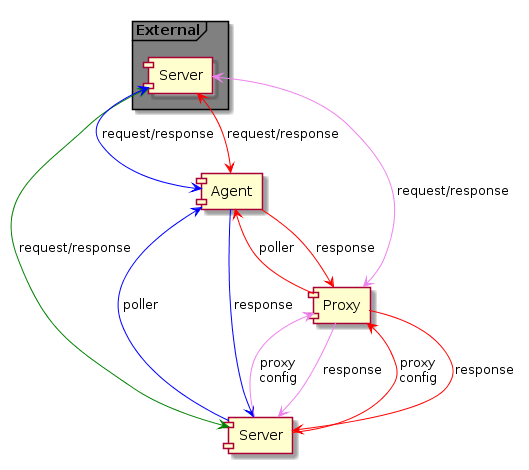
 - Server
→ external Zabbix instance (
- Server
→ external Zabbix instance (zabbix[stats,<ip>,<port>]) - Server →
proxy → external Zabbix instance (
- Server →
proxy → external Zabbix instance (zabbix[stats,<ip>,<port>]) - Server →
agent → external Zabbix instance (
- Server →
agent → external Zabbix instance (zabbix.stats[<ip>,<port>]) - Server →
proxy → agent → external Zabbix instance
(
- Server →
proxy → agent → external Zabbix instance
(zabbix.stats[<ip>,<port>])
To make sure that the target instance allows querying it by the external instance, list the address of the external instance in the 'StatsAllowedIP' parameter on the target instance.
Exposed metrics
The stats items gather the statistics in bulk and return a JSON, which is the basis for dependent items to get their data from. The following internal metrics are returned by either of the two items:
zabbix[boottime]zabbix[hosts]zabbix[items]zabbix[items_unsupported]zabbix[preprocessing_queue](server only)zabbix[process,<type>,<mode>,<state>](only process type based statistics)zabbix[rcache,<cache>,<mode>]zabbix[requiredperformance]zabbix[triggers](server only)zabbix[uptime]zabbix[vcache,buffer,<mode>](server only)zabbix[vcache,cache,<parameter>]zabbix[version]zabbix[vmware,buffer,<mode>]zabbix[wcache,<cache>,<mode>]('trends' cache type server only)
Templates
Templates are available for remote monitoring of Zabbix server or proxy internal metrics from an external instance:
- Remote Zabbix server
- Remote Zabbix proxy
Note that in order to use a template for remote monitoring of multiple external instances, a separate host is required for each external instance monitoring.
Trapper process
Receiving internal metric requests from an external Zabbix instance is handled by the trapper process that validates the request, gathers the metrics, creates the JSON data buffer and sends the prepared JSON back, for example, from server:
{
  "response": "success",
  "data": {
    "boottime": N,
    "uptime": N,
    "hosts": N,
    "items": N,
    "items_unsupported": N,
    "preprocessing_queue": N,
    "process": {
      "alert manager": {
        "busy": {
          "avg": N,
          "max": N,
          "min": N
        },
        "idle": {
          "avg": N,
          "max": N,
          "min": N
        },
        "count": N
      },
...
    },
    "queue": N,
    "rcache": {
      "total": N,
      "free": N,
      "pfree": N,
      "used": N,
      "pused": N
    },
    "requiredperformance": N,
    "triggers": N,
    "uptime": N,
    "vcache": {
      "buffer": {
        "total": N,
        "free": N,
        "pfree": N,
        "used": N,
        "pused": N
      },
      "cache": {
        "requests": N,
        "hits": N,
        "misses": N,
        "mode": N
      }
    },
    "vmware": {
      "total": N,
      "free": N,
      "pfree": N,
      "used": N,
      "pused": N
    },
    "version": "N",
    "wcache": {
      "values": {
        "all": N,
        "float": N,
        "uint": N,
        "str": N,
        "log": N,
        "text": N,
        "not supported": N
      },
      "history": {
        "pfree": N,
        "free": N,
        "total": N,
        "used": N,
        "pused": N
      },
      "index": {
        "pfree": N,
        "free": N,
        "total": N,
        "used": N,
        "pused": N
      },
      "trend": {
        "pfree": N,
        "free": N,
        "total": N,
        "used": N,
        "pused": N
      }
    }
  }
}
Internal queue items
There are also another two items specifically allowing to remote query internal queue stats on another Zabbix instance:
zabbix[stats,<ip>,<port>,queue,<from>,<to>]internal item - for direct internal queue queries to remote Zabbix server/proxyzabbix.stats[<ip>,<port>,queue,<from>,<to>]agent item - for agent-based internal queue queries to remote Zabbix server/proxy
See also: Internal items, Zabbix agent items