
2 Problems
Overview
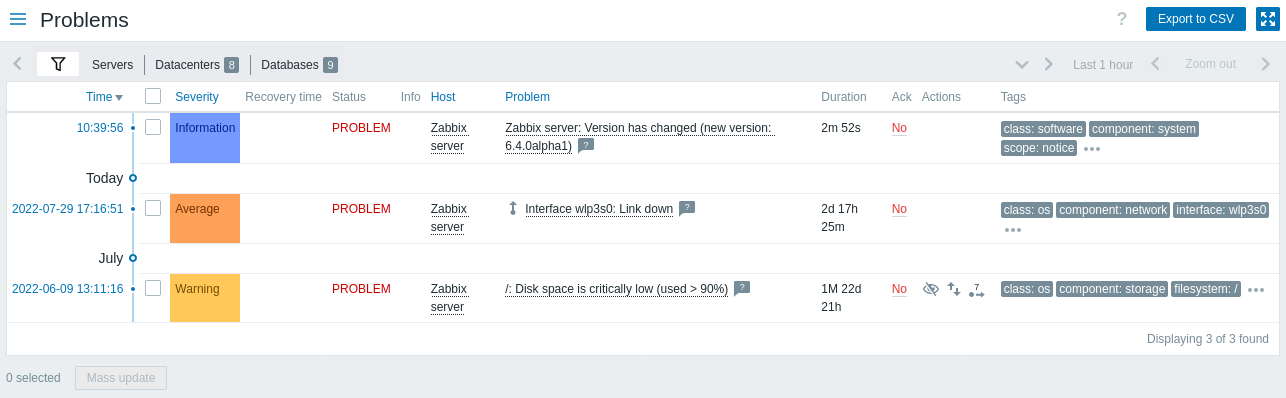
In Monitoring → Problems you can see what problems you currently have. Problems are those triggers that are in the "Problem" state.
| Column | Description |
|---|---|
| Time | Problem start time is displayed. |
| Severity | Problem severity is displayed. Problem severity is originally based on the severity of the underlying problem trigger, however, after the event has happened it can be updated using the Update problem screen. Color of the problem severity is used as cell background during problem time. |
| Recovery time | Problem resolution time is displayed. |
| Status | Problem status is displayed: Problem - unresolved problem Resolved - recently resolved problem. You can hide recently resolved problems using the filter. New and recently resolved problems blink for 2 minutes. Resolved problems are displayed for 5 minutes in total. Both of these values are configurable in Administration → General → Trigger displaying options. |
| Info | A green information icon is displayed if a problem is closed by global correlation or manually when updating the problem. Rolling a mouse over the icon will display more details: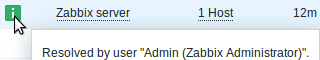 The following icon is displayed if a suppressed problem is being shown (see Show suppressed problems option in the filter). Rolling a mouse over the icon will display more details: 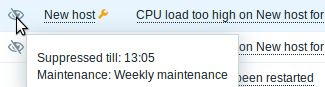 |
| Host | Problem host is displayed. |
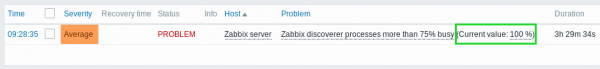
| Problem | Problem name is displayed. Problem name is based on the name of the underlying problem trigger. Macros in the trigger name are resolved at the time of the problem happening and the resolved values do not update any more. Note that it is possible to append the problem name with operational data showing some latest item values. Clicking on the problem name brings up the event menu. Hovering on the |
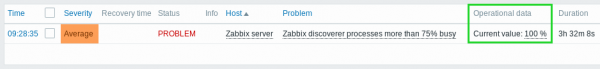
| Operational data | Operational data are displayed containing latest item values. Operational data can be a combination of text and item value macros if configured on a trigger level. If no operational data is configured on a trigger level, the latest values of all items from the expression are displayed. This column is only displayed if Separately is selected for Show operational data in the filter. |
| Duration | Problem duration is displayed. See also: Negative problem duration |
| Ack | The acknowledgment status of the problem is displayed: Yes - green text indicating that the problem is acknowledged. A problem is considered to be acknowledged if all events for it are acknowledged. No - a red link indicating unacknowledged events. If you click on the link you will be taken to the problem update screen where various actions can be taken on the problem, including commenting and acknowledging the problem. |
| Actions | History of activities about the problem is displayed using symbolic icons: When rolling the mouse over the icons, popups with details about the activity are displayed. See viewing details to learn more about icons used in the popup for actions taken. |
| Tags | Tags are displayed (if any). In addition, tags from an external ticketing system may also be displayed (see the Process tags option when configuring webhooks). |
Operational data of problems
It is possible to display operational data for current problems, i.e. the latest item values as opposed to the item values at the time of the problem.
Operational data display can be configured in the filter of Monitoring → Problems or in the configuration of the respective dashboard widget, by selecting one of the three options:
- None - no operational data is displayed
- Separately - operational data is displayed in a separate column
- With problem name - operational data is appended to the problem name and in parentheses. Operational data are appended to the problem name only if the Operational data field is non-empty in the trigger configuration.
The content of operational data can be configured with each
trigger, in the Operational data
field. This field accepts an arbitrary string with macros, most
importantly, the {ITEM.LASTVALUE<1-9>} macro.
{ITEM.LASTVALUE<1-9>} in this field will always resolve to the latest
values of items in the trigger expression. {ITEM.VALUE<1-9>} in this
field will resolve to the item values at the moment of trigger status
change (i.e. change into problem, change into OK, being closed manually
by a user or being closed by correlation).
Negative problem duration
It is actually possible in some common situations to have negative problem duration i.e. when the problem resolution time is earlier than problem creation time, e. g.:
- If some host is monitored by proxy and a network error happens, leading to no data received from the proxy for a while, the nodata(/host/key) trigger will be fired by the server. When the connection is restored, the server will receive item data from the proxy having a time from the past. Then, the nodata(/host/key) problem will be resolved and it will have a negative problem duration;
- When item data that resolve the problem event are sent by Zabbix sender and contain a timestamp earlier than the problem creation time, a negative problem duration will also be displayed.
Negative problem duration is not affecting SLA calculation or Availability report of a particular trigger in any way; it neither reduces nor expands problem time.
Mass editing options
Buttons below the list offer some mass-editing options:
- Mass update - update the selected problems by navigating to the problem update screen
To use this option, mark the checkboxes before the respective problems, then click on the Mass update button.
Buttons
The button to the right offers the following option:
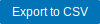 |
Export content from all pages to a CSV file. |
View mode buttons, being common for all sections, are described on the Monitoring page.
Using filter
You can use the filter to display only the problems you are interested in. For better search performance, data is searched with macros unresolved.
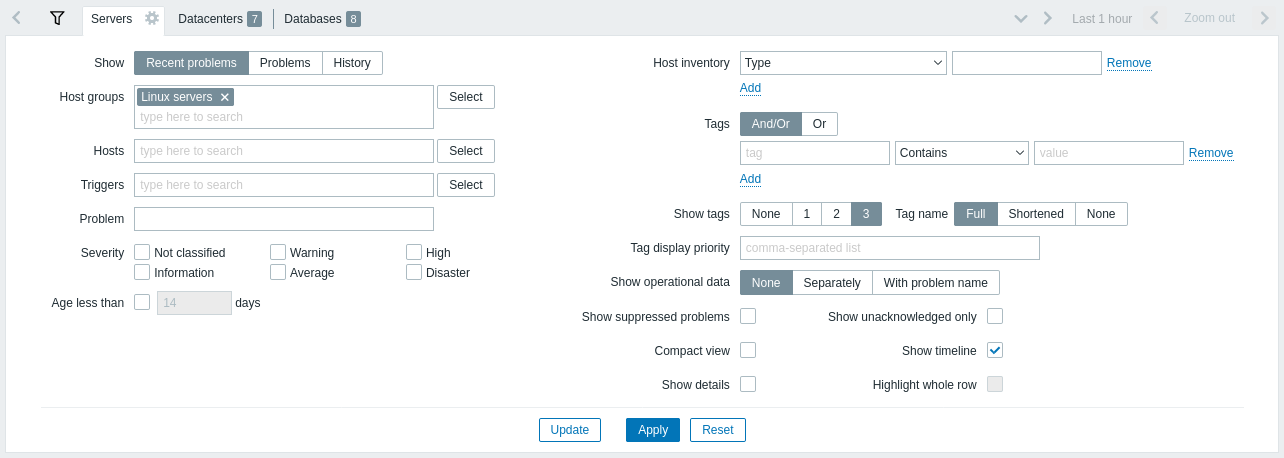
The filter is located above the table. Favorite filter settings can be saved as tabs and then quickly accessed by clicking on the tabs above the filter.
| Parameter | Description |
|---|---|
| Show | Filter by problem status: Recent problems - unresolved and recently resolved problems are displayed (default) Problems - unresolved problems are displayed History - history of all events is displayed |
| Host groups | Filter by one or more host groups. Specifying a parent host group implicitly selects all nested host groups. |
| Hosts | Filter by one or more hosts. |
| Triggers | Filter by one or more triggers. |
| Problem | Filter by problem name. |
| Severity | Filter by trigger (problem) severity. |
| Age less than | Filter by how old the problem is. |
| Host inventory | Filter by inventory type and value. |
| Tags | Filter by event tag name and value. It is possible to include as well as exclude specific tags and tag values. Several conditions can be set. Tag name matching is always case-sensitive. There are several operators available for each condition: Exists - include the specified tag names Equals - include the specified tag names and values (case-sensitive) Contains - include the specified tag names where the tag values contain the entered string (substring match, case-insensitive) Does not exist - exclude the specified tag names Does not equal - exclude the specified tag names and values (case-sensitive) Does not contain - exclude the specified tag names where the tag values contain the entered string (substring match, case-insensitive) There are two calculation types for conditions: And/Or - all conditions must be met, conditions having the same tag name will be grouped by the Or condition Or - enough if one condition is met When filtered, the tags specified here will be displayed first with the problem, unless overridden by the Tag display priority (see below) list. |
| Show tags | Select the number of displayed tags: None - no Tags column in Monitoring → Problems 1 - Tags column contains one tag 2 - Tags column contains two tags 3 - Tags column contains three tags To see all tags for the problem roll your mouse over the three dots icon. |
| Tag name | Select tag name display mode: Full - tag names and values are displayed in full Shortened - tag names are shortened to 3 symbols; tag values are displayed in full None - only tag values are displayed; no names |
| Tag display priority | Enter tag display priority for a problem, as a comma-separated list of tags (for example: Services,Applications,Application). Tag names only should be used, no values. The tags of this list will always be displayed first, overriding the natural ordering by alphabet. |
| Show operational data | Select the mode for displaying operational data: None - no operational data is displayed Separately - operational data is displayed in a separate column With problem name - append operational data to the problem name, using parentheses for the operational data |
| Show suppressed problems | Mark the checkbox to display problems that would otherwise be suppressed (not shown) because of host maintenance or single problem suppression. |
| Compact view | Mark the checkbox to enable compact view. |
| Show details | Mark the checkbox to display underlying trigger expressions of the problems. Disabled if Compact view checkbox is marked. |
| Show unacknowledged only | Mark the checkbox to display unacknowledged problems only. |
| Show timeline | Mark the checkbox to display the visual timeline and grouping. Disabled if Compact view checkbox is marked. |
| Highlight whole row | Mark the checkbox to highlight the full line for unresolved problems. The problem severity color is used for highlighting. Enabled only if the Compact view checkbox is marked in the standard blue and dark themes. Highlight whole row is not available in the high-contrast themes. |
Tabs for favorite filters
Frequently used sets of filter parameters can be saved in tabs.
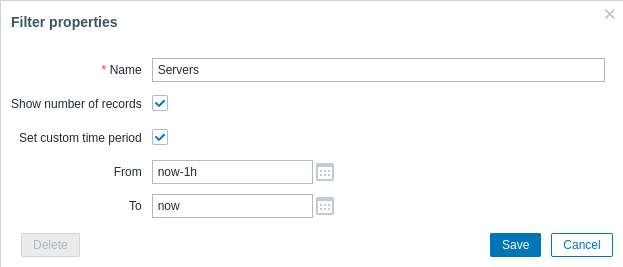
To save a new set of filter parameters, open the main tab, and configure the filter settings, then press the Save as button. In a new popup window, define Filter properties.
| Parameter | Description |
|---|---|
| Name | The name of the filter to display in the tab list. |
| Show number of records | Check, if you want the number of problems to be displayed next to the tab name. |
| Set custom time period | Check to set specific default time period for this filter set. If set, you will only be able to change the time period for this tab by updating filter settings. For tabs without a custom time period, the time range can be changed by pressing the time selector button in the top right corner (button name depends on selected time interval: This week, Last 30 minutes, Yesterday, etc.). This option is available only for filters in Monitoring→Problems. |
| From/To | Time period start and end in absolute (Y-m-d H:i:s) or relative time syntax (now-1d). Available, if Set custom time period is checked. |
When saved, the filter is created as a named filter tab and immediately activated.
To edit the filter properties of an existing filter, press the gear symbol next to the active tab name.
Notes:
- To hide the filter area, click on the name of the current tab. Click on the active tab name again to open the filter area again.
- Keyboard navigation is supported: use arrows to switch between tabs, press Enter to open.
- The left/right buttons above the filter may be used to switch between saved filters. Alternatively, the downward pointing button opens a drop-down menu with all saved filters and you can click on the one you need.
- Filter tabs can be re-arranged by dragging and dropping.
- If the settings of a saved filter have been changed (but not saved), a green dot is displayed after the filter name. To update the filter according to the new settings, click on the Update button, which is displayed instead of the Save as button.
- Current filter settings are remembered in the user profile. When the user opens the page again, the filter settings will have stayed the same.
To share filters, copy and send to others a URL of an active filter.
After opening this URL, other users will be able to save this set of parameters as a permanent filter in their Zabbix account.
See also: Page parameters.
Filter buttons
 |
Apply specified filtering criteria (without saving). |
 |
Reset current filter and return to saved parameters of the current tab. On the main tab, this will clear the filter. |
 |
Save current filter parameters in a new tab. Only available on the main tab. |
 |
Replace tab parameters with currently specified parameters. Not available on the main tab. |
Event menu
Clicking on the problem name brings up the event menu:
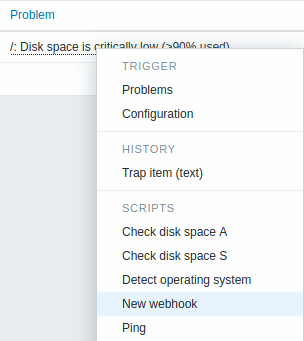
The event menu allows to:
- filter the problems of the trigger
- access the trigger configuration
- access a simple graph/item history of the underlying item(s)
- access an external ticket of the problem (if configured, see the Include event menu entry option when configuring webhooks)
- execute global scripts (these scripts need to have their scope defined as 'Manual event action'). This feature may be handy for running scripts used for managing problem tickets in external systems.
Viewing details
The times for problem start and recovery in Monitoring → Problems are links. Clicking on them opens more details of the event.
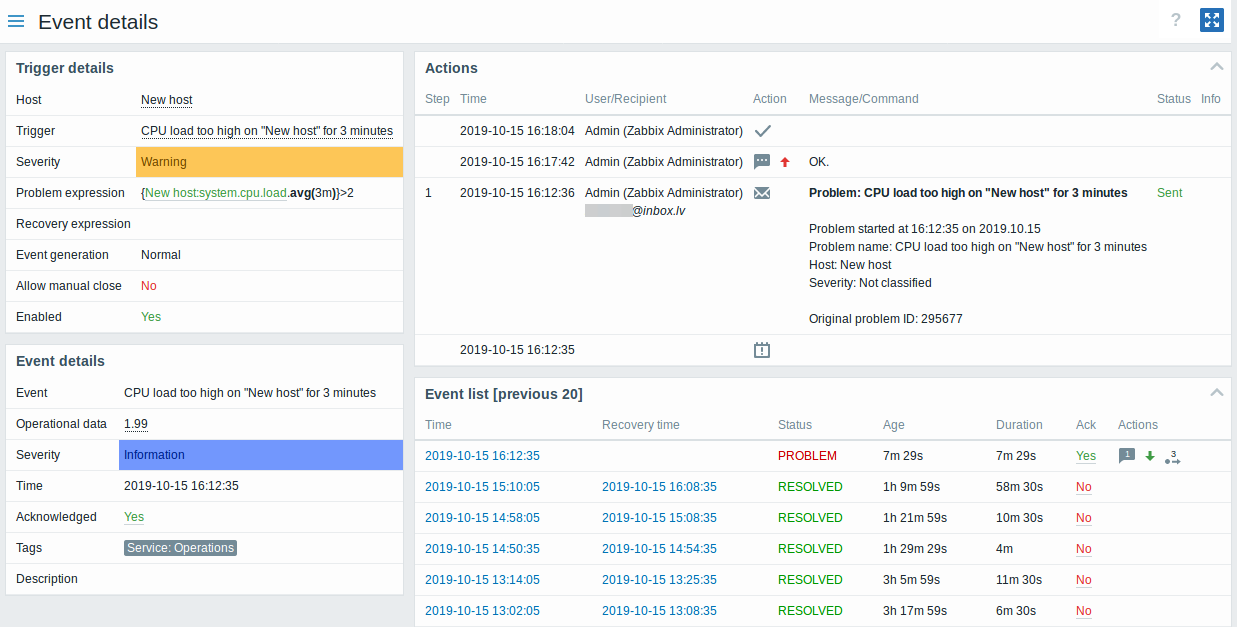
Note how the problem severity differs for the trigger and the problem event - for the problem event it has been updated using the Update problem screen.
In the action list, the following icons are used to denote the activity type:
 -
problem event generated
-
problem event generated -
message has been sent
-
message has been sent -
problem event acknowledged
-
problem event acknowledged -
problem event unacknowledged
-
problem event unacknowledged -
a comment has been added
-
a comment has been added -
problem severity has been increased (e.g. Information → Warning)
-
problem severity has been increased (e.g. Information → Warning) -
problem severity has been decreased (e.g. Warning → Information)
-
problem severity has been decreased (e.g. Warning → Information) -
problem severity has been changed, but returned to the original
level (e.g. Warning → Information → Warning)
-
problem severity has been changed, but returned to the original
level (e.g. Warning → Information → Warning) -
a remote command has been executed
-
a remote command has been executed -
problem event has recovered
-
problem event has recovered -
the problem has been closed manually
-
the problem has been closed manually -
the problem has been suppressed
-
the problem has been suppressed -
the problem has been unsuppressed
-
the problem has been unsuppressed