
On this page
11 Host availability
Overview
In the host availability widget, high-level statistics about host availability are displayed in four colored columns/lines.
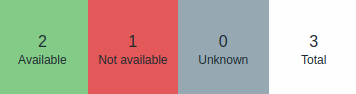 |
Horizontal display (columns). |
 |
Vertical display (lines). |
Host availability in each column/line is counted as follows:
- Available - hosts with all interfaces available
- Not available - hosts with at least one interface unavailable
- Unknown - hosts with at least one interface unknown (none unavailable)
- Total - total of all hosts
Configuration
To configure, select Host availability as type:
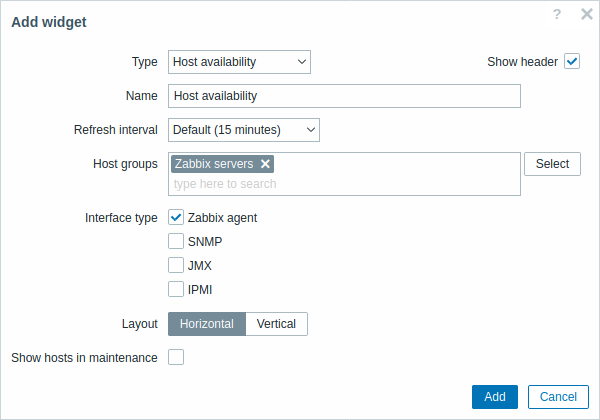
In addition to the parameters that are common for all widgets, you may set the following specific options:
| Host groups | Select host group(s). This field is auto-complete so starting to type the name of a group will offer a dropdown of matching groups. Scroll down to select. Click on 'x' to remove the selected. |
| Interface type | Select which host interfaces you want to see availability data for. Availability of all interfaces is displayed by default if nothing is selected. |
| Layout | Select horizontal display (columns) or vertical display (lines). |
| Show hosts in maintenance | Include hosts that are in maintenance in the statistics. |