On this page
10 Graph prototype
Overview
In the graph prototype widget, you can display a grid of graphs created from either a graph prototype or an item prototype by low-level discovery.
Configuration
To configure, select Graph prototype as widget type:
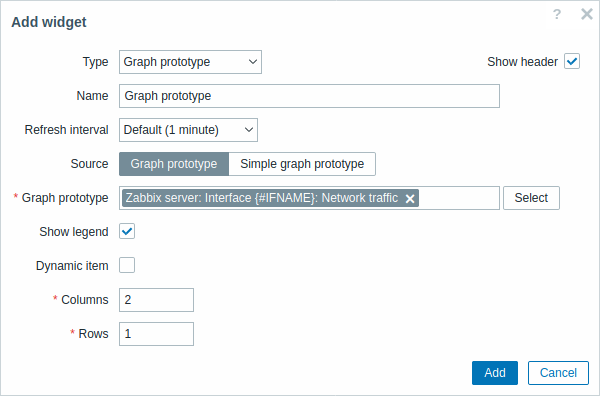
In addition to the parameters that are common for all widgets, you may set the following specific options:
| Source | Select source: either a Graph prototype or a Simple graph prototype. |
| Graph prototype | Select a graph prototype to display discovered graphs of the graph prototype. This option is available if 'Graph prototype' is selected as Source. |
| Item prototype | Select an item prototype to display simple graphs based on discovered items of an item prototype. This option is available if 'Simple graph prototype' is selected as Source. |
| Show legend | Mark this checkbox to show the legend on the graphs (marked by default). |
| Dynamic item | Set graphs to display different data depending on the selected host. |
| Columns | Enter the number of columns of graphs to display within a graph prototype widget. |
| Rows | Enter the number of rows of graphs to display within a graph prototype widget. |
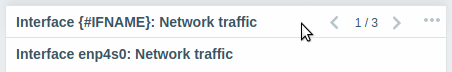
While the Columns and Rows settings allow fitting more than one graph in the widget, there still may be more discovered graphs than there are columns/rows in the widget. In this case paging becomes available in the widget and a slide-up header allows to switch between pages using the left and right arrows.