
1 Proxies
Overview
A Zabbix proxy can collect performance and availability data on behalf of the Zabbix server. This way, a proxy can take on itself some of the load of collecting data and offload the Zabbix server.
Also, using a proxy is the easiest way of implementing centralized and distributed monitoring, when all agents and proxies report to one Zabbix server and all data is collected centrally.
A Zabbix proxy can be used to:
- Monitor remote locations
- Monitor locations having unreliable communications
- Offload the Zabbix server when monitoring thousands of devices
- Simplify the maintenance of distributed monitoring
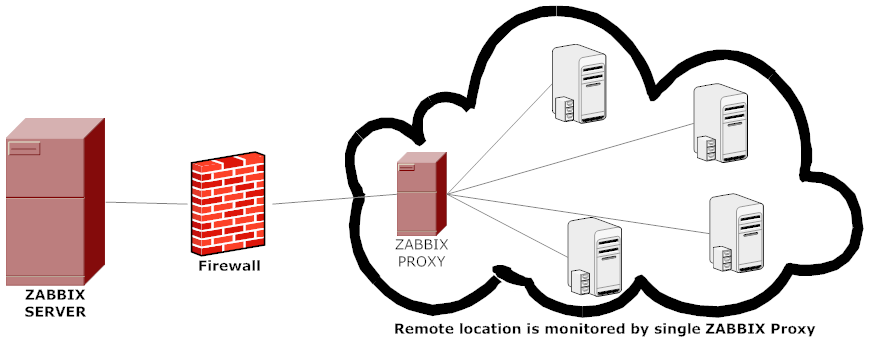
The proxy requires only one TCP connection to the Zabbix server. This way it is easier to get around a firewall as you only need to configure one firewall rule.
Zabbix proxy must use a separate database. Pointing it to the Zabbix server database will break the configuration.
All data collected by the proxy is stored locally before transmitting it over to the server. This way no data is lost due to any temporary communication problems with the server. The ProxyLocalBuffer and ProxyOfflineBuffer parameters in the proxy configuration file control for how long the data are kept locally.
It may happen that a proxy, which receives the latest configuration changes directly from Zabbix server database, has a more up-to-date configuration than Zabbix server whose configuration may not be updated as fast due to the value of CacheUpdateFrequency. As a result, proxy may start gathering data and send them to Zabbix server that ignores these data.
Zabbix proxy is a data collector. It does not calculate triggers, process events or send alerts. For an overview of what proxy functionality is, review the following table:
| Function | Supported by proxy | |
|---|---|---|
| Items | ||
| Zabbix agent checks | Yes | |
| Zabbix agent checks (active) | Yes 1 | |
| Simple checks | Yes | |
| Trapper items | Yes | |
| SNMP checks | Yes | |
| SNMP traps | Yes | |
| IPMI checks | Yes | |
| JMX checks | Yes | |
| Log file monitoring | Yes | |
| Internal checks | Yes | |
| SSH checks | Yes | |
| Telnet checks | Yes | |
| External checks | Yes | |
| Dependent items | Yes | |
| Script items | Yes | |
| Built-in web monitoring | Yes | |
| Item value preprocessing | Yes | |
| Network discovery | Yes | |
| Active agent autoregistration | Yes | |
| Low-level discovery | Yes | |
| Remote commands | Yes | |
| Calculating triggers | No | |
| Processing events | No | |
| Event correlation | No | |
| Sending alerts | No | |
[1] To make sure that an agent asks the proxy (and not the server) for active checks, the proxy must be listed in the ServerActive parameter in the agent configuration file.
Protection from overloading
If Zabbix server was down for some time, and proxies have collected a lot of data, and then the server starts, it may get overloaded (history cache usage stays at 95-100% for some time). This overload could result in a performance hit, where checks are processed slower than they should. Protection from this scenario was implemented to avoid problems that arise due to overloading history cache.
When Zabbix server history cache is full the history cache write access is being throttled, stalling server data gathering processes. The most common history cache overload case is after server downtime when proxies are uploading gathered data. To avoid this proxy throttling was added (currently it cannot be disabled).
Zabbix server will stop accepting data from proxies when history cache usage reaches 80%. Instead those proxies will be put on a throttling list. This will continue until the cache usage falls down to 60%. Now server will start accepting data from proxies one by one, defined by the throttling list. This means the first proxy that attempted to upload data during the throttling period will be served first and until it's done the server will not accept data from other proxies.
This throttling mode will continue until either cache usage hits 80% again or falls down to 20% or the throttling list is empty. In the first case the server will stop accepting proxy data again. In the other two cases the server will start working normally, accepting data from all proxies.
The above information can be illustrated in the following table:
| History write cache usage |
Zabbix server mode | Zabbix server action |
|---|---|---|
| Reaches 80% | Wait | Stops accepting proxy data, but maintains a throttling list (prioritized list of proxies to be contacted later). |
| Drops to 60% | Throttled | Starts processing throttling list, but still not accepting proxy data. |
| Drops to 20% | Normal | Drops the throttling list and starts accepting proxy data normally. |
You may use the zabbix[wcache,history,pused] internal item to correlate this behavior of Zabbix
server with a metric.
Configuration
Once you have installed and configured a proxy, it is time to configure it in the Zabbix frontend.
Adding proxies
To configure a proxy in Zabbix frontend:
- Go to: Administration → Proxies
- Click on Create proxy
| Parameter | Description | |
|---|---|---|
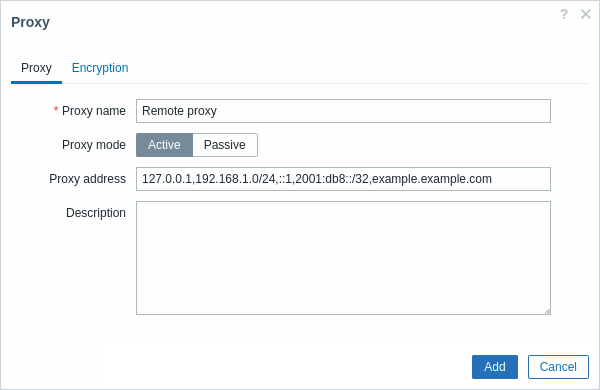
| Proxy name | Enter the proxy name. It must be the same name as in the Hostname parameter in the proxy configuration file. | |
| Proxy mode | Select the proxy mode. Active - the proxy will connect to the Zabbix server and request configuration data Passive - Zabbix server connects to the proxy Note that without encrypted communications (sensitive) proxy configuration data may become available to parties having access to the Zabbix server trapper port when using an active proxy. This is possible because anyone may pretend to be an active proxy and request configuration data if authentication does not take place or proxy addresses are not limited in the Proxy address field. |
|
| Proxy address | If specified then active proxy requests are only accepted from this list of comma-delimited IP addresses, optionally in CIDR notation, or DNS names of active Zabbix proxy. This field is only available if an active proxy is selected in the Proxy mode field. Macros are not supported. This option is supported since Zabbix 4.0.0. |
|
| Interface | Enter interface details for the passive proxy. This field is only available if a passive proxy is selected in the Proxy mode field. |
|
| IP address | IP address of the passive proxy (optional). | |
| DNS name | DNS name of the passive proxy (optional). | |
| Connect to | Clicking the respective button will tell Zabbix server what to use to retrieve data from proxy: IP - Connect to the proxy IP address (recommended) DNS - Connect to the proxy DNS name |
|
| Port | TCP/UDP port number of the passive proxy (10051 by default). | |
| Description | Enter the proxy description. | |
The Encryption tab allows you to require encrypted connections with the proxy.
| Parameter | Description |
|---|---|
| Connections to proxy | How the server connects to the passive proxy: no encryption (default), using PSK (pre-shared key) or certificate. |
| Connections from proxy | Select what type of connections are allowed from the active proxy. Several connection types can be selected at the same time (useful for testing and switching to other connection type). Default is "No encryption". |
| Issuer | Allowed issuer of certificate. Certificate is first validated with CA (certificate authority). If it is valid, signed by the CA, then the Issuer field can be used to further restrict allowed CA. This field is optional, intended to use if your Zabbix installation uses certificates from multiple CAs. |
| Subject | Allowed subject of certificate. Certificate is first validated with CA. If it is valid, signed by the CA, then the Subject field can be used to allow only one value of Subject string. If this field is empty then any valid certificate signed by the configured CA is accepted. |
| PSK identity | Pre-shared key identity string. Do not put sensitive information in the PSK identity, it is transmitted unencrypted over the network to inform a receiver which PSK to use. |
| PSK | Pre-shared key (hex-string). Maximum length: 512 hex-digits (256-byte PSK) if Zabbix uses GnuTLS or OpenSSL library, 64 hex-digits (32-byte PSK) if Zabbix uses mbed TLS (PolarSSL) library. Example: 1f87b595725ac58dd977beef14b97461a7c1045b9a1c963065002c5473194952 |
The editing form of an existing proxy has the following additional buttons:
- Refresh configuration - refresh configuration of the proxy
- Clone - create a new proxy based on the properties of the existing proxy
- Delete - delete the proxy
Host configuration
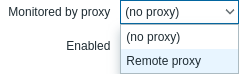
You can specify that an individual host should be monitored by a proxy in the host configuration form, using the Monitored by proxy field.
Host mass update is another way of specifying that hosts should be monitored by a proxy.