
On this page
6 图形
简介
单击 监测 → 图形 可以访问所有已配置的 自定义图形 。
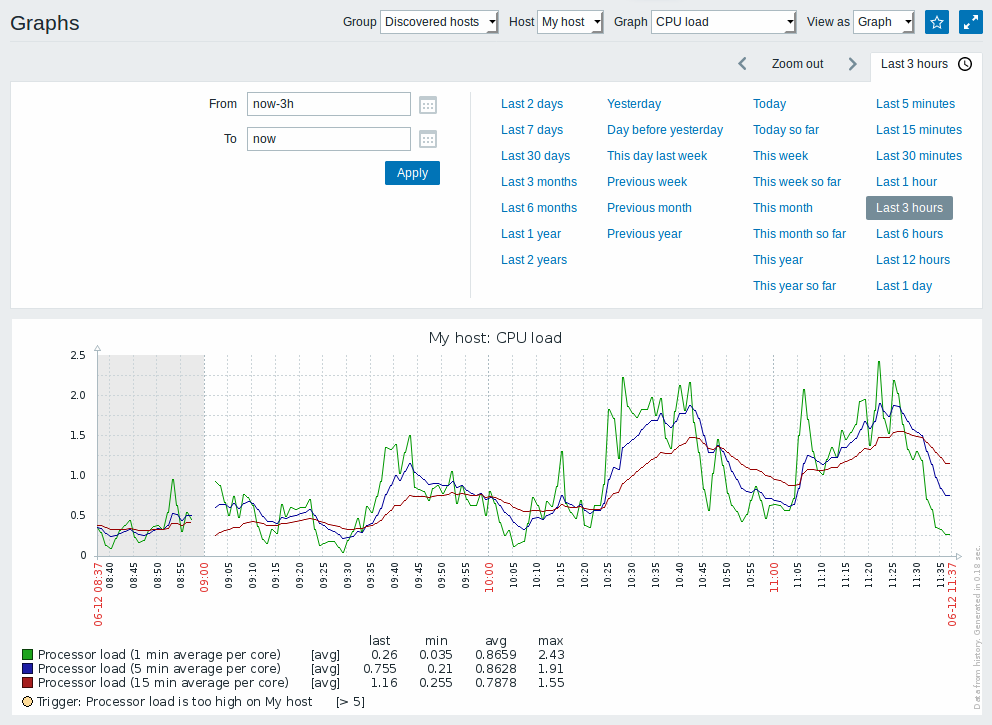
要显示一个图形,按顺序在页面右上的群组、主机及图形三个下拉菜单中选择需要显示的图形。
注意: 在主机下拉菜单中,被禁用主机以红色突出显示。从Zabbix2.2.0起,被禁用主机图形也可以从本页可以访问。
时段选择器
图表上方的时间段选择器。 它允许通过单击鼠标选择经常需要的时间段。
参考: 时间段选择器
控制
标题栏中有三个可用按钮:
 -
在仪表板(Dashboard)中的收藏部件中添加图表
-
在仪表板(Dashboard)中的收藏部件中添加图表 -
使用完整的浏览器窗口来显示图表。
-
使用完整的浏览器窗口来显示图表。
Time period selector
Take note of the time period selector above the graph. It allows to select often required periods with one mouse click.
See also: Time period selector
Buttons
Buttons to the right offer the following options:
|
Add graph to the favorites widget in the Dashboard. |
 |
The graph is in the favorites widget in the Dashboard. Click to remove graph from the favorites widget. |
 |
Display page in fullscreen mode. |
 |
Display page in kiosk mode. In this mode only page content displayed. The kiosk mode button appears when the fullscreen mode is activated. To exit kiosk mode, move the mouse cursor until the  exit button appears and click on it. Note that you will be taken back to normal mode (not fullscreen mode). exit button appears and click on it. Note that you will be taken back to normal mode (not fullscreen mode). |