
8 队列
概述
在 Administration → Queue 中,显示等待升级的监控项。
理想情况下,当您打开此部分时,应该都是“绿色”的,表示队列中没有任何监控项。 如果所有监控项都没有延迟更新,则没有等待。 但是,由于服务器性能匮乏,连接问题或proxy问题,有些监控项可能会延迟,并且在该区域中显示信息。 有关详细信息,请参阅Queue队列 。
队列仅在Zabbix服务器运行时可用。
从右上角的下拉菜单中您可以选择:
- 监控项类型队列概述
- Proxy队列概述
- 延时监控项列表
监控项类型概述
在此屏幕中,如果异常与一个或多个监控项类型相关,则可以轻松找到它。
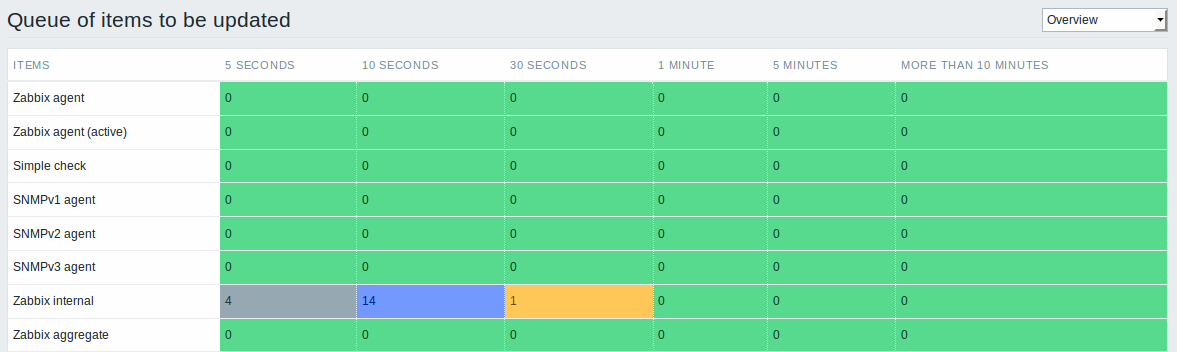
每行包含一个监控项类型。 每列显示等待监控项的数量 - 等待5-10秒/ 10-30秒/ 30-60秒/ 1-5分钟/ 5-10分钟或超过10分钟。
Proxy概述
在此屏幕中,如果异常与agent或sever之一相关,则可以轻松找到它。
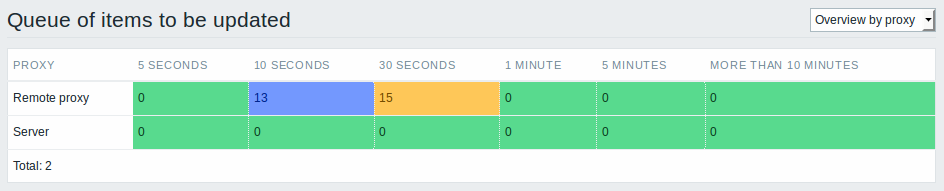
每行包含一个proxy,sever在列表的最后一个。 每列显示等待监控项的数量 - 等待5-10秒/ 10-30秒/ 30-60秒/ 1-5分钟/ 5-10分钟或超过10分钟。
等待监控项列表
在下屏中,每个等待监控项被列了出来。
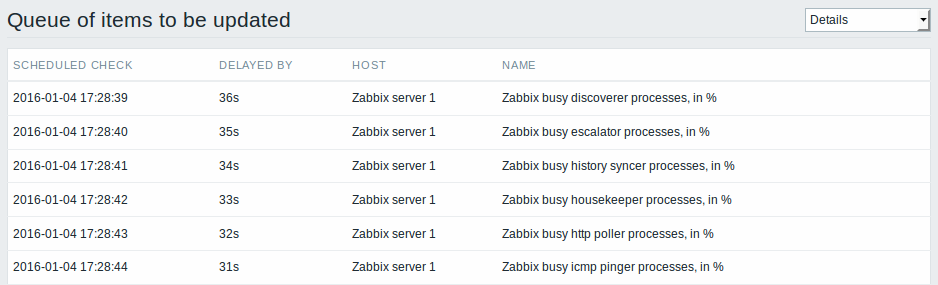
在主机列中,由proxy监视的主机以proxy名称为前缀(从Zabbix 2.4.0起)。
显示的数据:
| 列 | 述 |
|---|---|
| Next check | 显示检查到期的时间。 |
| Delayed by | 显示延迟的长度。 |
| Host | 显示监控项的主机。 |
| Name | 显示等待监控项的名称。 |
可能的错误消息
您可能会遇到没有数据显示的情况,并显示以下错误消息:
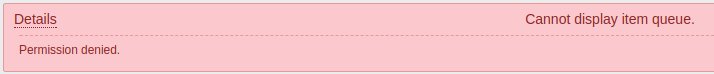
在这种情况下的错误消息如下:
Cannot display item queue. Permission denied当zabbix.conf.php中的PHP配置参数$ZBX_SERVER_PORT或$ZBX_SERVER指向使用不同数据库的现有Zabbix服务器时,会发生这种情况。
8 Queue
Overview
In the Administration → Queue section items that are waiting to be updated are displayed.
Ideally, when you open this section it should all be "green" meaning no items in the queue. If all items are updated without delay, there are none waiting. However, due to lacking server performance, connection problems or problems with agents, some items may get delayed and the information is displayed in this section. For more details, see the Queue section.
Queue is available only if Zabbix server is running.
From the dropdown in the upper right corner you can select:
- queue overview by item type
- queue overview by proxy
- list of delayed items
Overview by item type
In this screen it is easy to locate if the problem is related to one or several item types.
Each line contains an item type. Each column shows the number of waiting items - waiting for 5-10 seconds/10-30 seconds/30-60 seconds/1-5 minutes/5-10 minutes or over 10 minutes respectively.
Overview by proxy
In this screen it is easy to locate if the problem is related to one of the proxies or the server.
Each line contains a proxy, with the server last in the list. Each column shows the number of waiting items - waiting for 5-10 seconds/10-30 seconds/30-60 seconds/1-5 minutes/5-10 minutes or over 10 minutes respectively.
List of waiting items
In this screen, each waiting item is listed.
In the host column, hosts monitored by proxy are prefixed with the proxy name (since Zabbix 2.4.0).
Displayed data:
| Column | Description |
|---|---|
| Next check | The time when the check was due is displayed. |
| Delayed by | The length of the delay is displayed. |
| Host | Host of the item is displayed. |
| Name | Name of the waiting item is displayed. |
Possible error messages
You may encounter a situation when no data is displayed and the following error message appears:
Error message in this case is the following:
Cannot display item queue. Permission deniedThis happens when PHP configuration parameters $ZBX_SERVER_PORT or $ZBX_SERVER in zabbix.conf.php point to existing Zabbix server which uses different database.