2 Web场景监控
2 Real life scenario
概述
Overview
本节介绍了如何使用 Web 监控的示例。
This section presents a step-by-step real-life example of how web monitoring can be used.
我们使用 Zabbix Web 监控来监控 Zabbix 的 Web 界面。我们想知道它是否可用、是否正常工作以及响应速度。为此,我们还必须使用我们的用户名和密码登录下。
Let's use Zabbix web monitoring to monitor the web interface of Zabbix. We want to know if it is available, provides the right content and how quickly it works. To do that we also must log in with our user name and password.
场景
Scenario
第 1 步
Step 1
创建新的 Web 场景。
Add a new web scenario.
我们将添加一个场景来监控 Zabbix 的 Web 界面。该场景将执行多个步骤。
We will add a scenario to monitor the web interface of Zabbix. The scenario will execute a number of steps.
转到 // 配置 (Configuration) → 主机 (Hosts)//, 选择一个主机,然后在该主机行中单击 Web。 然后单击 Create scenario.
Go to Configuration → Hosts, pick a host and click on Web in the row of that host. Then click on Create web scenario.
All mandatory input fields are marked with a red asterisk.
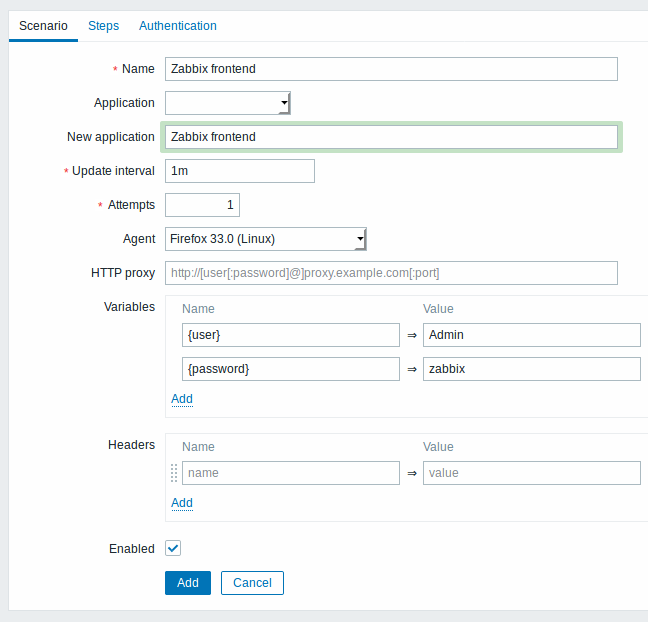
在新的场景中,我们将场景命名为 Zabbix frontend,并为其创建一个新的 Zabbix frontend 应用 (application )。
In the new scenario form we will name the scenario as Zabbix frontend and create a new Zabbix frontend application for it.
注意,我们还将创建两个变量:{user}和{password}。
Note that we will also create two variables: {user} and {password}.
第 2 步
Step 2
定义场景的步骤
Define steps for the scenario.
Click on Add button in the Steps tab to add individual steps.
Web 场景步骤 1
Web scenario step 1
单击 Steps 选项卡中的 Add 按钮添加单独的步骤。
我们首先检查第一页响应是否正确,返回 HTTP 响应代码 200,并包含文本“Zabbix SIA”。
We start by checking that the first page responds correctly, returns with HTTP response code 200 and contains text "Zabbix SIA".
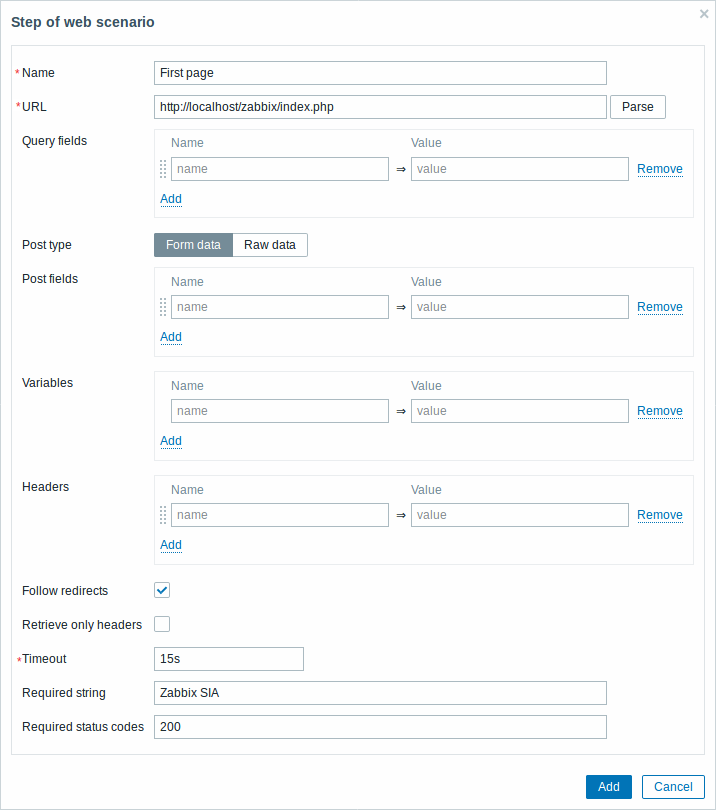
完成配置步骤后,单击 Add。
When done configuring the step, click on Add.
Web scenario step 2
我们继续登录 Zabbix 前端,我们通过我们在场景级别{user}和{password}上定义的宏(变量)来实现。
We continue by logging in to the Zabbix frontend, and we do so by reusing the macros (variables) we defined on the scenario level - {user} and {password}.
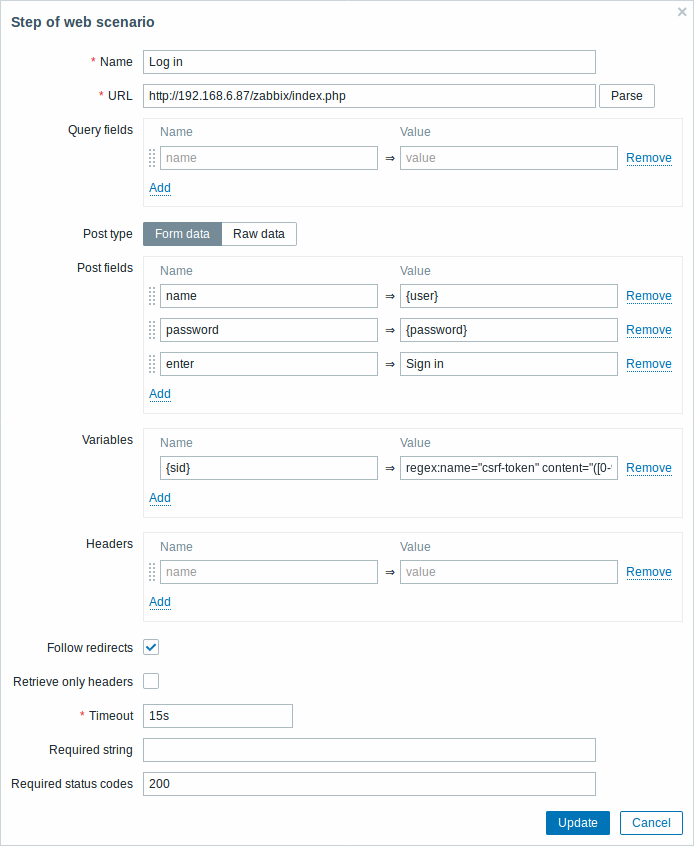
注意,Zabbix 前端在登录时使用 JavaScript 重定向,因此首先我们必须登录,只有在下一步的步骤中,我们才能检查登录功能。此外,登录步骤必须使用完整的 URL 以获取index.php文件
Note that Zabbix frontend uses JavaScript redirect when logging in, thus first we must log in, and only in further steps we may check for logged-in features. Additionally, the login step must use full URL to index.php file.
还要注意我们如何使用正则表达式的变量语法获取{sid}变量(会话
ID)的内容:<?nowiki>?regex:name ="sid"value ="([0-9a-z] {16})"</?nowiki>。步骤
4 中会使用此变量。
Take note also of how we are getting the content of the {sid} variable
(session ID) using a variable syntax with regular expression:
regex:name="sid" value="([0-9a-z]{16})". This variable will be
required in step 4.
Web 场景步骤 3
Web scenario step 3
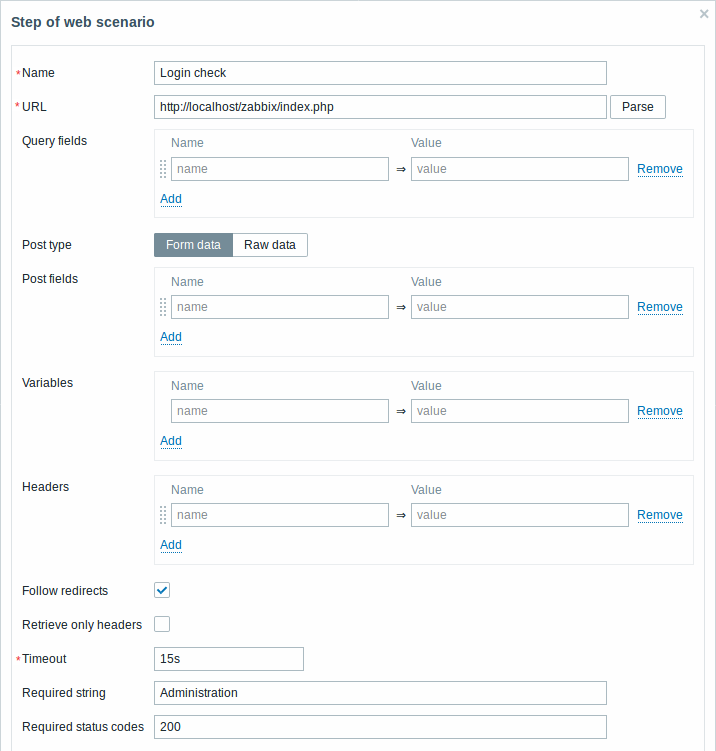
登录后,我们现在应该验证一下是否登陆成功。为此,我们检查一个仅在登录后可见的字符串
- 例如Administration (管理)。
Being logged in, we should now verify the fact. To do so, we check for a string that is only visible when logged in - for example, Administration.
Web 场景步骤 4
Web scenario step 4
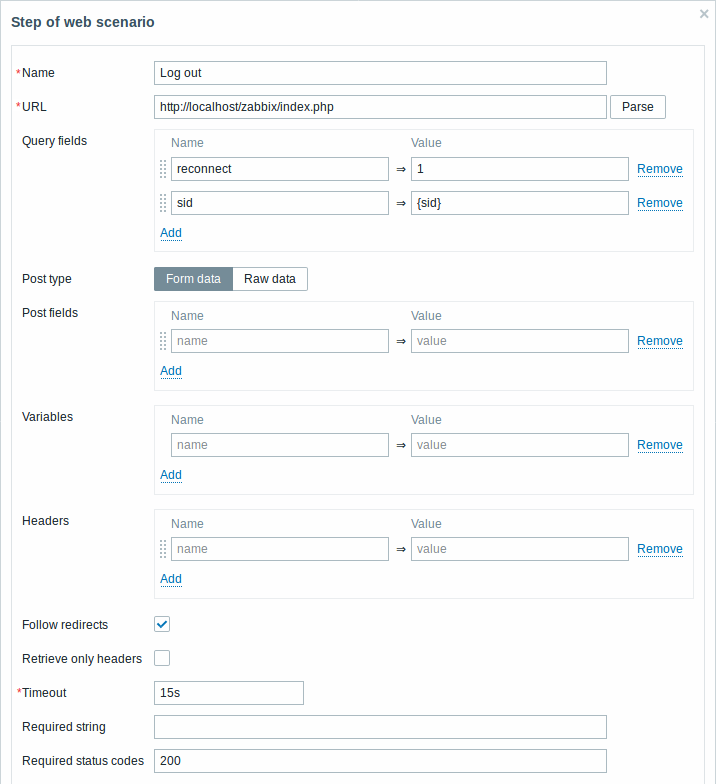
现在我们已经验证了前端是可访问的,我们可以登录并检索登录的内容,我们也应该注销
- 否则 Zabbix 数据库将被大量的开放会话记录所污染。
Now that we have verified that frontend is accessible and we can log in and retrieve logged-in content, we should also log out - otherwise Zabbix database will become polluted with lots and lots of open session records.
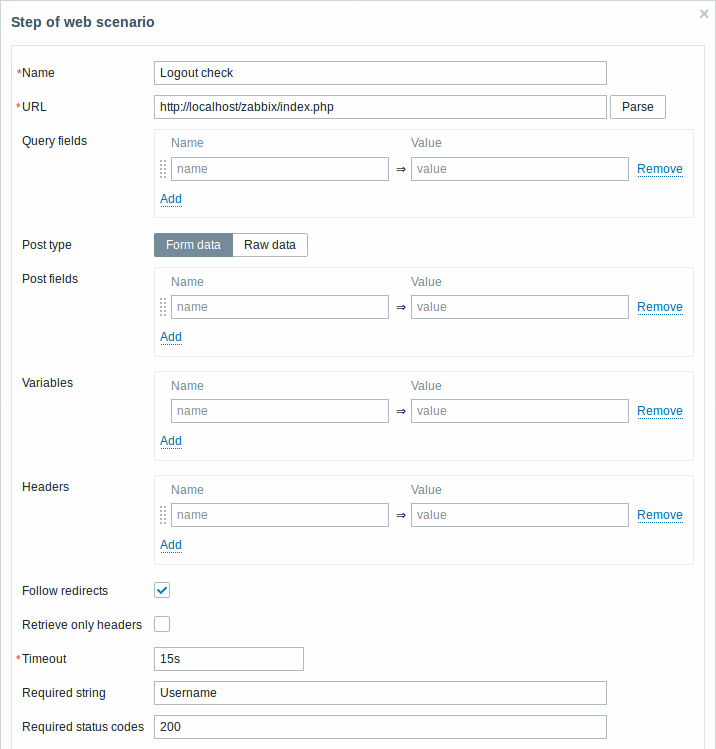
Web scenario step 5
我们可以通过查找用户名字符串来检查我们是否已经注销了。
We can also check that we have logged out by looking for the Username string.
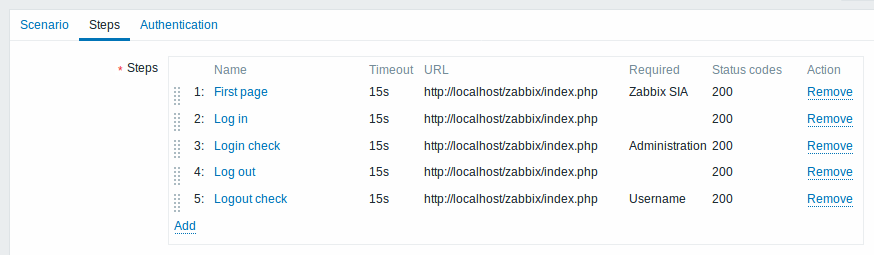
// 完成步骤配置 //
Complete configuration of steps
Web 场景步骤的完整配置应如下所示:
A complete configuration of web scenario steps should look like this:
第 3 步
Step 3
保存 Web 监控场景。
Save the finished web monitoring scenario.
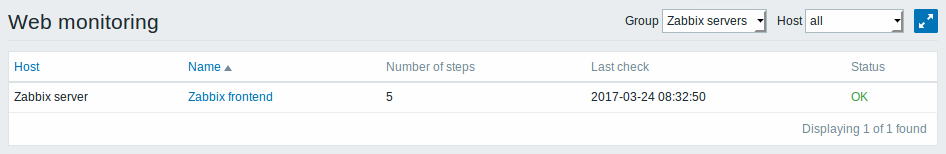
通过以下方式查看场景 Monitoring → Web:
The scenario will appear in Monitoring → Web:
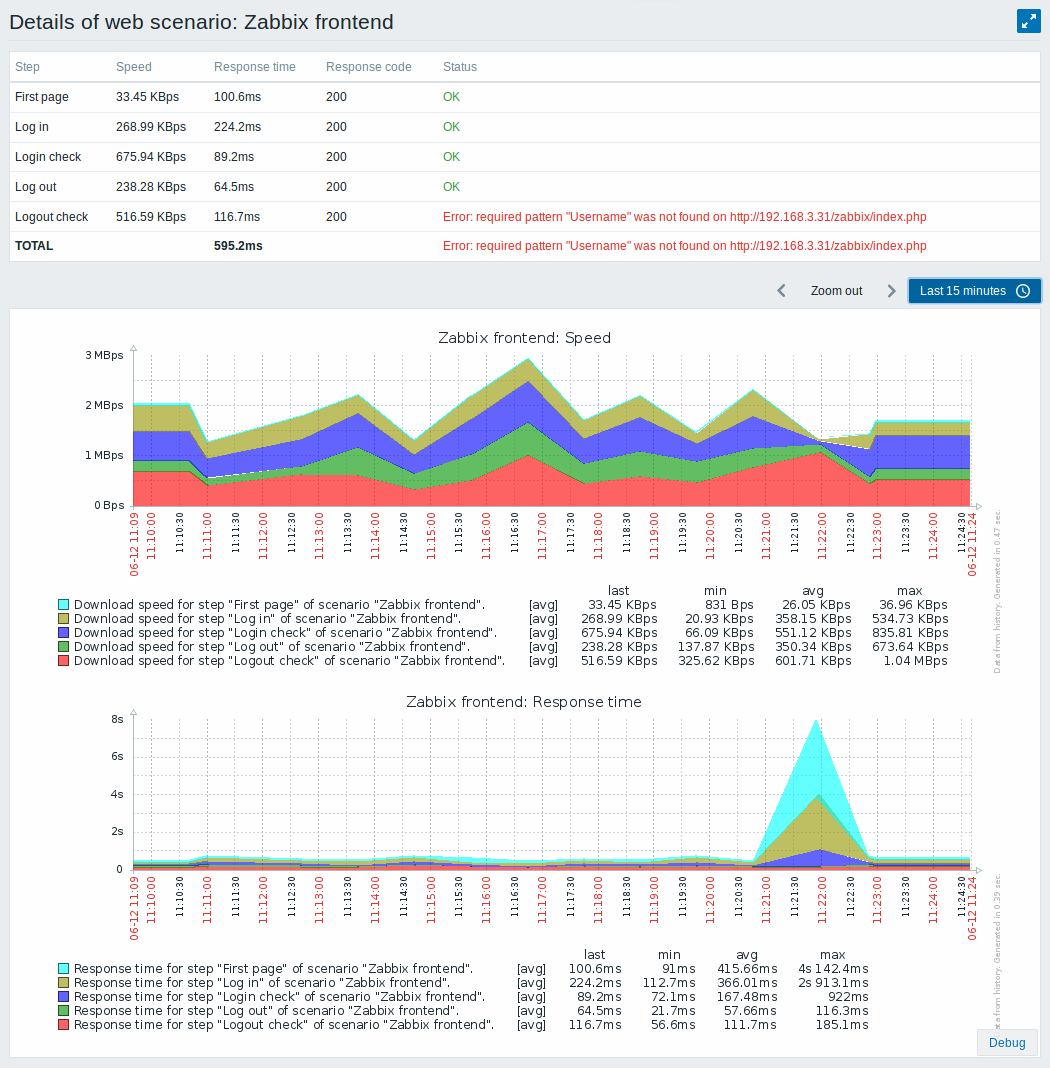
单击场景名称以查看更详细的统计信息:
Click on the scenario name to see more detailed statistics: