8. Service 服务监控[ZeMing]
8. Service monitoring
Zabbix 4.0.0 正式版目前,暂未发布,敬请期待,目前阶段** alpha9** 。
概述
Overview
服务(Serivce)监控功能是为帮助那些想要在IT基础设施监控之上获得更高层面(业务)监控需求的人设计。在许多情况下,我们不关心底层设施监控细节,比如磁盘空间不足,CPU高负载等等。我们关心的是IT部门提供的服务(业务)整体的可用性。我们还关心在 整体IT基础设施中最薄弱的环节,以及各种IT服务的SLA指标(SLA服务等级协议),更关心识别现有IT基础设施架构薄弱环节,以及更高层面(业务)的监控信息。
Service monitoring functionality is intended for those who want to get a high-level (business) view of monitored infrastructure. In many cases, we are not interested in low-level details, like the lack of disk space, high processor load, etc. What we are interested in is the availability of service provided by our IT department. We can also be interested in identifying weak places of IT infrastructure, SLA of various IT services, the structure of existing IT infrastructure, and other information of a higher level.
Zabbix 服务监控(service)就是针对上述问题提出的解决方案。
Zabbix service monitoring provides answers to all mentioned questions.
服务监控(service)是分层表现监控数据的。
Services is a hierarchy representation of monitored data.
下面我们来看一个非常简单的服务监控(service)例子:
A very simple service structure may look like:
Service
|
|-Workstations
| |
| |-Workstation1
| |
| |-Workstation2
|
|-Servers
在结构上每个节点都具有监控属性状态。这个状态根据所选算法计算状态关联上层状态,服务监控(service)功能最底层是关联的触发器(triggers)。每个节点状态都是受其触发器(triggers)状态影响。
Each node of the structure has attribute status. The status is calculated and propagated to upper levels according to the selected algorithm. At the lowest level of services are triggers. The status of individual nodes is affected by the status of their triggers.
提示:触发器(triggers)的严重等级 如:不分类(Not classified) 或信息(Information)是不影响SLA指标(SLA服务等级协议)计算的。
Note that triggers with a Not classified or Information severity do not impact SLA calculation.
配置
Configuration
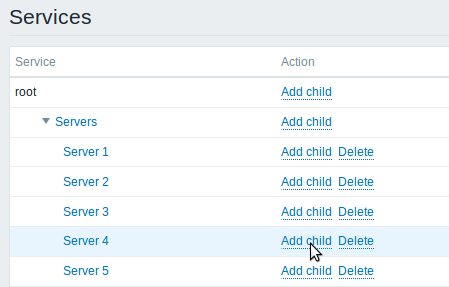
配置服务监控(service),请访问:配置(Configuration) → 服务监控(Services). To configure services, go to: Configuration → Services.
在该界面,您可以创建一个分层监控结构。 最高的父节点服务是'root'。您可以向下创建更低层服务监控(service)子节点,实现相互层级结构。
On this screen you can build a hierarchy of your monitored infrastructure. The highest-level parent service is 'root'. You can build your hierarchy downward by adding lower-level parent services and then individual nodes to them.
在这个屏幕上,您可以构建被监视的基础结构的层次结构。最高级的父服务是“root”。您可以向下构建层次结构,方法是添加低级的父服务,然后向它们添加单个节点。

点击 添加子节点(Add child) 增加服务监控(service)。 点击名称可编辑已该服务监控(service),您可以通过弹出的界面编辑该服务监控(service)属性。
Click on Add child to add services. To edit an existing service, click on its name. A form is displayed where you can edit the service attributes.
配置一个服务监控(service)
Configuring a service
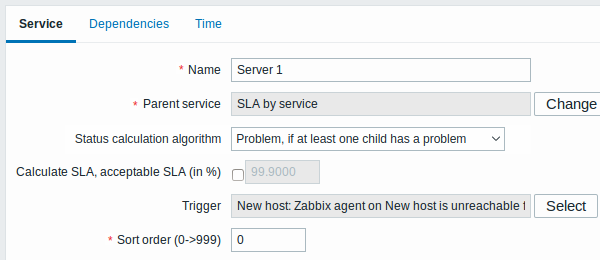
服务监控(service) 选项包含通用的服务监控(service)属性
The Service tab contains general service attributes:

所有必填字段都标有*红色星号。
All mandatory input fields are marked with a red asterisk.
| 参数 说 | ||
|---|---|---|
| 名称(Name) 服务监 | 名称. | |
| 上层服务(Parent service) 服务监控( | ervice) 从属的上层父节点 | |
| 状态计算算法(Status calculation algorithm) 服务监控(se | vice)状态计算方法:\ 服务状态的计算方法:\ \ *不要计算(Do not calculate) - 不计算节点状态。 问题, 如果至少一个下层有一个问题(Problem, if at least one child has a problem) -只要一个子节点有异常,该节点就异常。 问题, 如果所有的下层都有问题(Problem, if all children have problems) - 当所有节点都异常时,该节点才异常。 |
*不计算* *,不计算服务状态\ \ * *问题,如果至少有一个子节点服务有问题* *——问题状态,如果至少一个子节点服务有问题\ \ * *问题,如果所有的孩子都有问题* *——问题状态,如果所有的子服务有问题 |
| 计算SLA(Calculate SLA) 勾选✔ | 是否计算SLA指标。 | |
| 可接受的SAL(%)(Acceptable SLA (in %)) 此服务监控 | service)节点,可接受的SLA百分比,用于报告。 | |
| 触发器(Trigger) 选择关联 | 触发器(Trigger): None - 没有关联的触发器(Trigger) 触发器名称(trigger name) - 选择绑定触发器(Trigger),因此节点状态依赖触发器(Trigger)状态 . 最底层服务计算必须依赖触发器状态(否则,它们的状态将无法得到准确的计算) 当触发器被关联后,其触发器以前的状态告警是不计算的。 |
|
| 排序(Sort order) 显示排 | 的顺序,数字小的优先 | |
| Parameter | Description |
|---|---|
| Name | Service name. |
| Parent service | Parent service the service belongs to. |
| Status calculation algorithm | Method of calculating service status: Do not calculate - do not calculate service status Problem, if at least one child has a problem - problem status, if at least one child service has a problem Problem, if all children have problems - problem status, if all child services are having problems |
| Calculate SLA | Enable SLA calculation and display. |
| Acceptable SLA (in %) | SLA percentage that is acceptable for this service. Used for reporting. |
| Trigger | Linkage to trigger: None - no linkage trigger name - linked to the trigger, thus depends on the trigger status Services of the lowest level must be linked to triggers. (Otherwise their state will not be represented accurately.) When triggers are linked, their state prior to linking is not counted. |
| Sort order | Sort order for display, lowest comes first. |
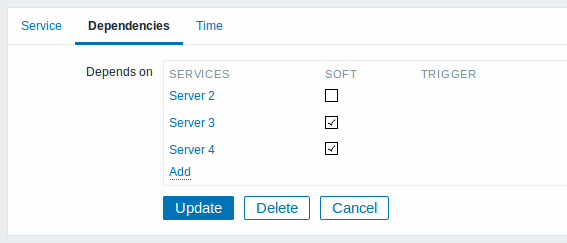
依赖关系(Dependencies) 选项卡可以看到该服务监控(service)所有子节点。单击 Add 增加一个之前配置过的 服务监控(service)节点。
The Dependencies tab contains services the service depends on. Click on Add to add a service from those that are configured.

硬依赖和软依赖(Hard and soft dependency) Hard and soft dependency
服务的可用性指标,可能取决于其他多个服务,而不仅仅是一个。 界面第一个选项服务监控(service)是直接增加子节点。
Availability of a service may depend on several other services, not just one. The first option is to add all those directly as child services.
而然,如果服务(service)在其他节点已增加过,则不能简单的将它移动到该子节点。那该如何创建服务(service)节点依赖?这个问题答案是"软链接"。增加一个服务(service) 依赖是,勾选√软连接(soft)选项。通过这种方式,服务(service)可以保留节点之前原始位置,有可以绑定依赖到其他服务(service)上。这种“软连接”的服务(service)节点在服务树上显示是灰色的。另外,如果一个服务只有一个“软连接”节点,就可以删除此服务,而不用删除软连接的子节点。
However, if some service is already added somewhere else in the services tree, it cannot be simply moved out of there to a child service here. How to create a dependency on it? The answer is "soft" linking. Add the service and mark the Soft check box. That way the service can remain in its original location in the tree, yet be depended upon from several other services. Services that are "soft-linked" are displayed in grey in the tree. Additionally, if a service has only "soft" dependencies, it can be deleted directly, without deleting child services first.
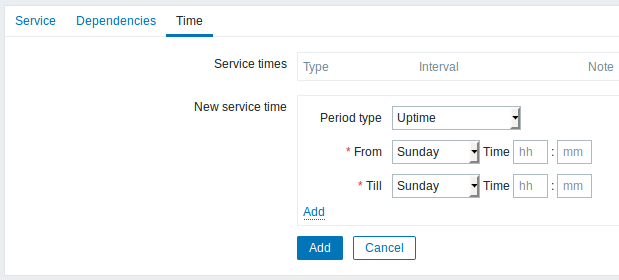
时间(Time) 选型,用于设置服务(service)的工作时间。 The Time tab contains the service time specification.

| 参数 说 | |
|---|---|
| 服务时间(Service times) 默认,所有 | 务(Service)都是预设 24x7x365 统计时间,如有特殊需要,请增加 新的服务时间(New service time)。 |
| 新的服务时间(New service time) 服务时间(Se | vice times): 在线时间(Uptime) - 服务正常运行时间 故障停机时间(Downtime) - 故障停机时间周期内不会纳入SLA服务时间统计. 单次停机(One-time downtime) - 单次停机时间,在该时间阶段内不会纳入SLA服务时间统计a single downtime. Service state within this period does not affect SLA. 增加相应的时间段。 Note: 服务时间仅影响其配置的服务(Service)。因此,父节点服务(Service)不会考虑子节点(Service)上配置的服务时间(Service times)(除非您在父节点也配置相应的服务时间)。\\在前端页面计算服务(Service)状态和SLA时,会考虑这个服务时间(Service times)。然而需要您知道是,不管服务时间如何配置计算,关于服务(Service)原始可用性信息仍会连续不断写入到数据库中。 |
| Parameter | Description |
|---|---|
| Service times | By default, all services are expected to operate 24x7x365. If exceptions needed, add new service times. |
| New service time | Service times: Uptime - service uptime Downtime - service state within this period does not affect SLA. One-time downtime - a single downtime. Service state within this period does not affect SLA. Add the respective hours. Note: Service times affect only the service they are configured for. Thus, a parent service will not take into account the service time configured on a child service (unless a corresponding service time is configured on the parent service as well). Service times are taken into account when calculating service status and SLA by the frontend. However, information on service availability is being inserted into database continuously, regardless of service times. |
前端显示
Display
服务(Service),去 监控中(Monitoring)-→ 服务(Service)
To monitor services, go to Monitoring → Services.

