3 Ad-hoc graphs
Overview
While a simple graph is great for accessing data of one item and custom graphs offer customization options, none of the two allow to quickly create a comparison graph for multiple items with little effort and no maintenance.
To address this issue, since Zabbix 2.4 it is possible to create ad-hoc graphs for several items in a very quick way.
Configuration
To create an ad-hoc graph, do the following:
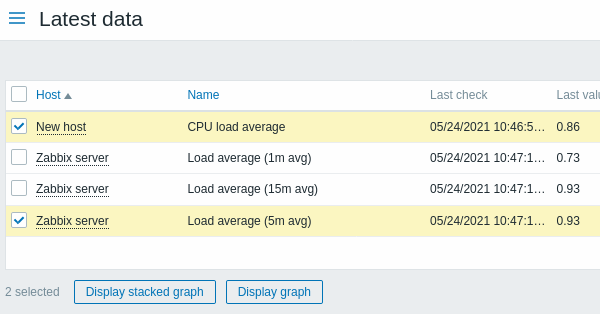
- Go to Monitoring → Latest data
- Use filter to display items that you want
- Mark checkboxes of the items you want to graph
- Click on Display stacked graph or Display graph buttons
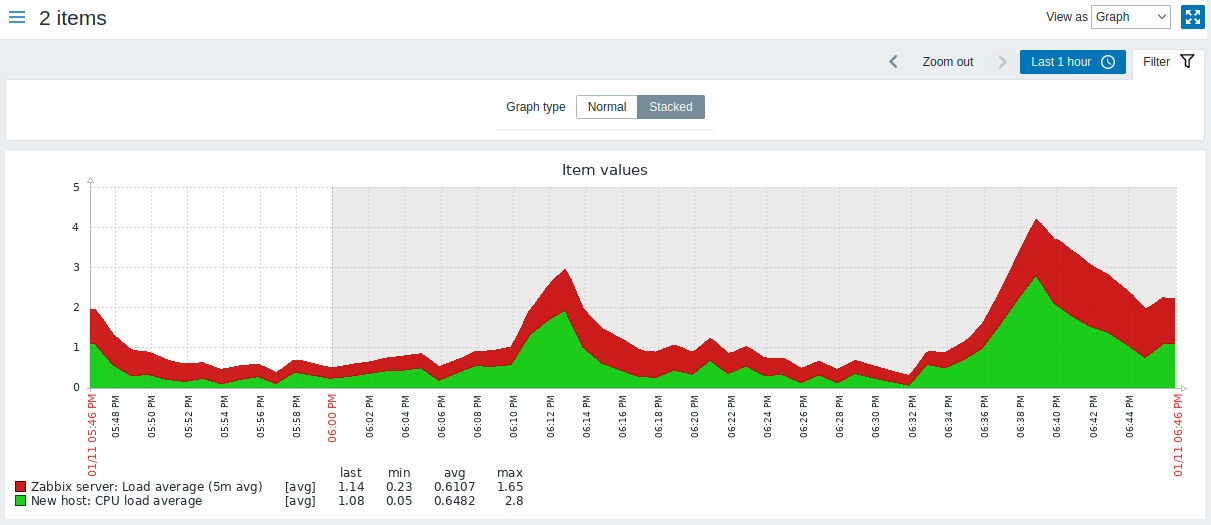
Your graph is created instantly:
Note that to avoid displaying too many lines in the graph, only the average value for each item is displayed (min/max value lines are not displayed). Triggers and trigger information is not displayed in the graph.
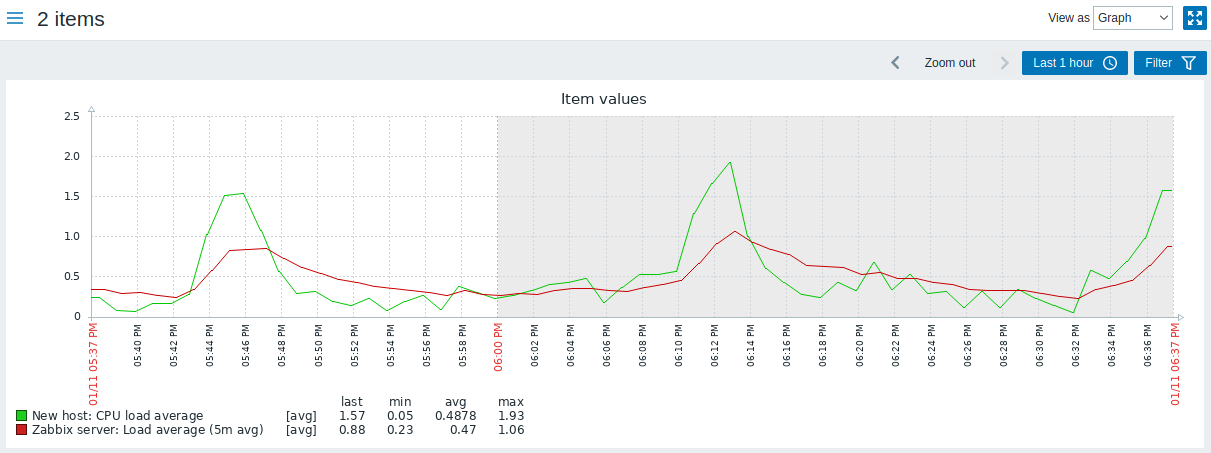
In the created graph window you have the time period selector available and the possibility to switch from the "normal" line graph to a stacked one (and back).