
1 仪表板小构件
简介
本文列出了一些可用的 dashboard 小构建,并且提供了一些配置方法。
以下参数对于每个小构建都是通用的:
| Name | 输入小构件名称。 |
| Refresh interval | 配置默认刷新间隔。 窗口小构件的默认刷新间隔范围为无刷新(No refresh)到15分钟(15 minutes)取决于窗口小构件的类型。 例如:没有刷新用于URL小构件,1分钟用于操作日志小构件,15分钟用于时钟小构件。 |
可以将窗口小构件的刷新间隔设置为统一的一个默认值,另外每个用户也可以设置自己的刷新间隔值:
- 如果要设置全局用户的默认刷新值,请切换到编辑模式(单击“编辑仪表板”按钮,找到要设置的小构件,单击“编辑”按钮,编辑小构件表单是 现在打开)并从下拉列表中选择所需的刷新间隔。
- 通过单击某个窗口小构件的
 按钮,可以在视图模式下单独为某个用户设置唯一的刷新间隔。
注意的是,单独针对某个用户刷新值的优先级大于全局默认刷新值的优先级。设置后会如果不再更改的话会一直保留。
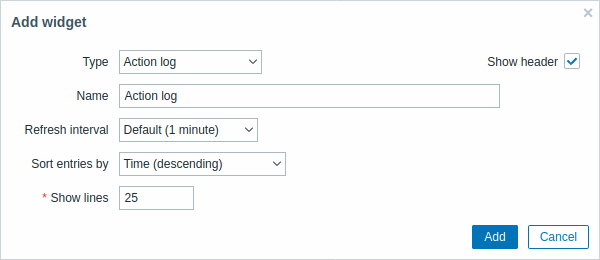
动作日志
In the action log widget you can display details of action operations (notifications, remote commands). It replicates information from Administration → Audit.
To configure, select Action log as type:
 |
|---|
你可以设置以下特定选项:
| 以目标排序 以目标排 | : 时间(Time) (升序 或者 降序) 类型(Type) (升序 或者 降序) 状态(Status) (升序 或者 降序) 接收(Recipient) (升序 或者 降序)。 |
| 展示行 设置 | 口小构件中将显示的操作日志行数。 |
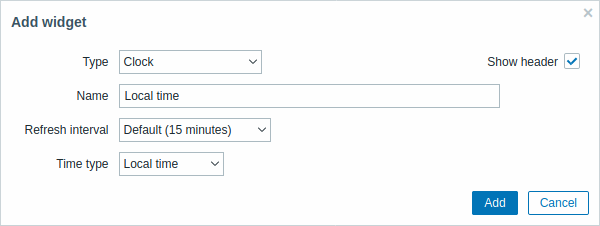
时钟
在时钟小构件中,您可以显示本地、服务器或指定的主机时间。
如果要配置, 请选择 时钟(Clock) 类型:
 |
|---|
你可以设置以下特定选项:
| 时间类型 本地时 | 、服务器时间或者指定某个服务器的时间。 |
| 项目 选 | 显示时间的项目。 要显示主机时间,请使用 system.localtime[local] 这个功能仅允许在设置显示服务器时间时使用。 主机时间(Host time) 选中。 |
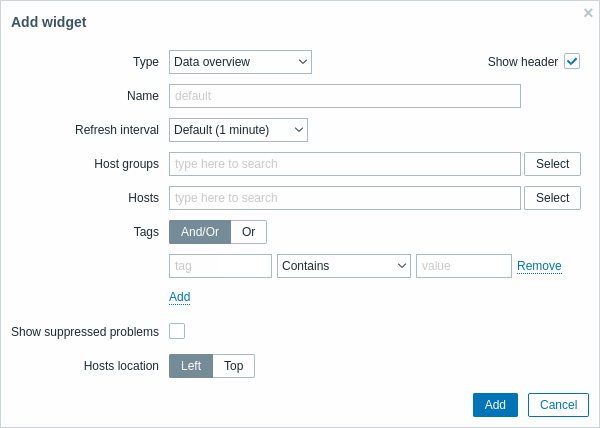
数据概述
在数据概述窗口小构件中,您可以显示一组主机的最新数据。 窗口内容数据源取自 监测中 → 概述 (数据类型选择 数据(Data)).
如果你要配置 //数据概述 // 类型:
 |
|---|
你可以使用以下特定配置选项:
| 主机组 输入 | 机组关键字即可触发自动匹配,选择需要设置的主机组即可,如果想要删除则单击主机组旁边的X来进行删除。 |
| 应用 输 | 应用名称。 |
| 主机地址 选择主 | 位置,左侧或者顶部。 |
自动发现状态
此小构件显示启用的网络发现规则状态摘要。
喜欢的图表
此小构件包含最需要的图表的快捷方式。 当您查看图形时单击其添加到收藏夹按钮时,将填充快捷方式列表。
喜欢的拓扑图
此小构件包含最需要的拓扑图的快捷方式。 当您查看图形时单击其添加到收藏夹按钮时,将填充快捷方式列表。
喜欢的聚合图形
此小构件包含最需要的聚合图形的快捷方式。 当您查看图形时单击其添加到收藏夹按钮时,将填充快捷方式列表。
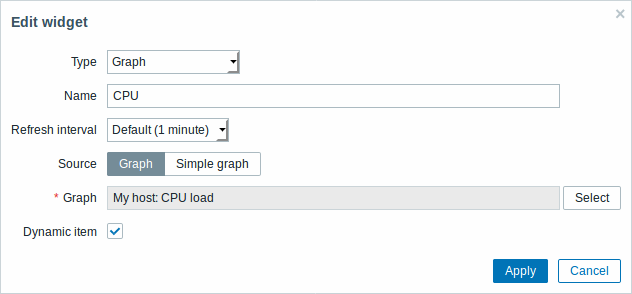
图形
在图表小构件中,您可以展示某个自定义图形或简单图形。
如果要配置, 请选择 图形(Graph) 类型:
 |
|---|
你可以设置以下特定选项:
| 来源 选 | 图形类型: 图形 - 自定义 简单图形 - 简单图 |
| 图形 要 | 示自定义图形时。源应该选择为\\“图形”。 |
| 选项 要 | 示简单图形时源应该选择为\\“简单图形”。 |
| 动态监控项 设置图表 | 据所选主机显示不同的数据。 |
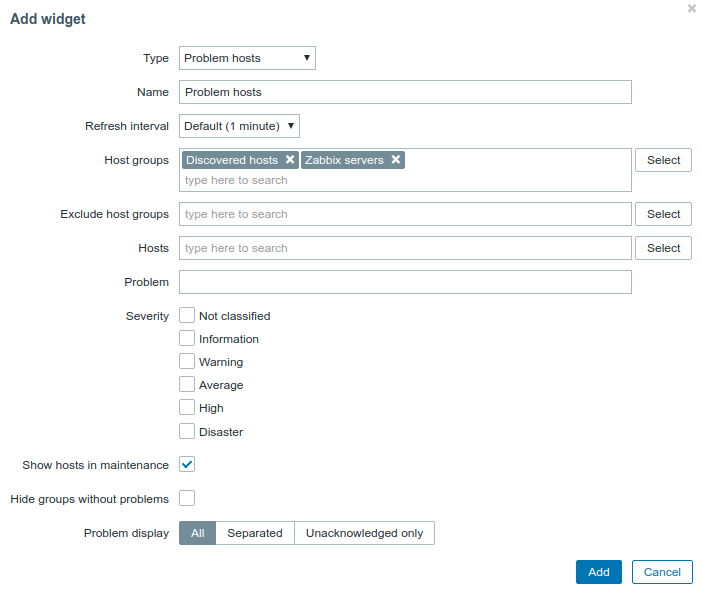
异常主机
在主机信息窗口小构件中,可以展示有关主机可用性的高级信息。
如果你需要设置,请选择 异常主机(Problem hosts)类型:
 |
|---|
你可以设置以下特定选项:
| 参数类型 功能说 | |
|---|---|
| 主机组 输入 | 机组关键字即可触发自动匹配,选择需要设置的主机组即可,如果想要删除则单击主机组旁边的X来进行删除。 \\指定父主机组会隐式选择所有嵌套的主机组。\\来自这些主机组的主机数据将显示在小构件。 如果不输入主机组,默认展示所有主机组信息。 |
| 排除主机组 输入要从 | 口小构件隐藏的主机组。输入主机组关键字即可触发自动匹配,选择需要设置的主机组即可,如果想要删除则单击主机组旁边的X来进行删除。\\指定父主机组会隐式选择所有嵌套的主机组。\\来自这些主机组的主机数据将不会显示在小构件。 例如,主机001,002,003也可以在组A中,并且主机002,003也可以在组B中。 如果我们选择同时显示组A和排除组B,则只有来自主机001的数据才会显示在仪表板中。 |
| 主机 输 | 要展示的主机,仅输入关键词即可实现自动匹配后进行选择。 如果你不输入任何内容默认显示所有主机。 |
| 问题 你 | 以设置过滤仅展示哪些问题,或者展示哪些主机的哪些问题。 如果想进行关键字过滤可以再like或者Equal输入字符。 宏不会触发匹配。 |
| 问题等级 选择哪 | 问题等级可以在此窗口中展示。 |
| 显示维护中的主机 选择此项后,如 | 主机处于异常并且同时又在维护中的时候依然会显示,默认勾选。如果不需要可以取消勾选。 |
| Hide groups without problems | Mark the Hide groups without problems option to hide data from host groups without problems in the widget. |
| 显示问题 显示问 | 统计: 所有 - 展示所有问题数。 分隔 - 未确认的问题数将以总问题数分开显示 未确认问题 - 仅显示未确认的问题计数。 |
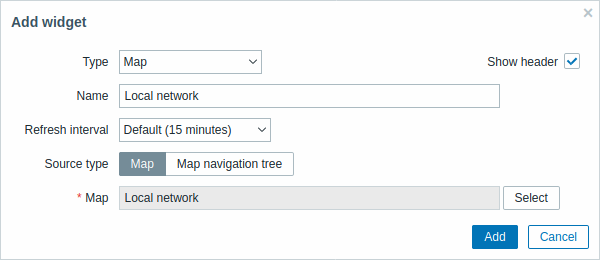
拓扑图
使用拓扑图小构件展示:
- 单独的网络映射
- 拓扑图导航树中配置的网络拓扑图(单击树中的拓扑图名称时)。
配置中选择 拓扑图(Map) 类型:
 |
|---|
你可以设置以下选项:
| 来源类型 选择显 | : 拓扑图 - 网络拓扑图 拓扑图导航树 - 所选拓扑图导航树中的一个拓扑图 |
| 地图 选 | 要显示的拓扑图。当选择“拓扑图”类型作为源类型时可用。 |
| 过滤 选 | 拓扑图导航树显示。当选择“拓扑图导航树”作为源类型时可用。 |
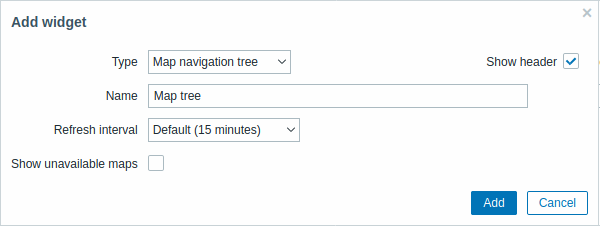
拓扑图导航树
此窗口小构件允许构建现有拓扑图的层次结构,同时还显示每个包含的拓扑图和拓扑图组的问题统计信息。
如果将 拓扑图 小构件链接到导航树,它会变得更加强大。 在这种情况下,单击导航树中的拓扑图名称会在 拓扑图 小构件中完整显示拓扑图。
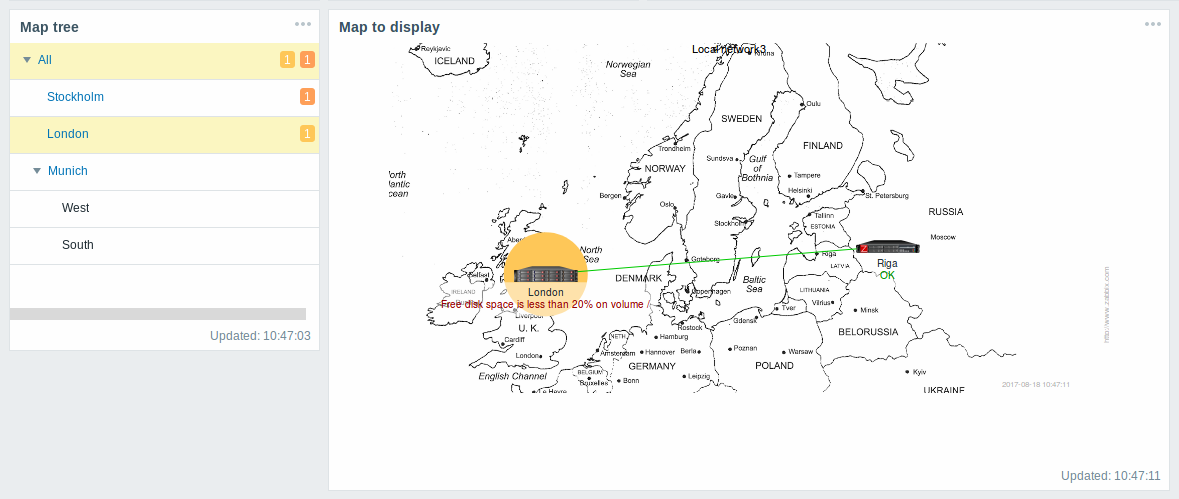
在分层展示中,最上面一层将会展示所有问题的总和。
要配置导航树窗口小构件,请选择拓扑图导航树(Map navigation tree)作为类型:
 |
|---|
你还需要配置以下选项:
| 展示不可用的拓扑图 选中此复选框以显 | 用户没有读取权限的拓扑图。 导航树中的不可用拓扑图将显示为带有灰色图标。 注意,如果标记了此复选框,则即使显示可用的子拓扑图,也会显示 父级别拓扑图是无关紧要的。 如果未标记,则根本不会显示不可用父图的可用子图。 问题计数是根据可用的拓扑图和可用的拓扑图元素计算的。 |
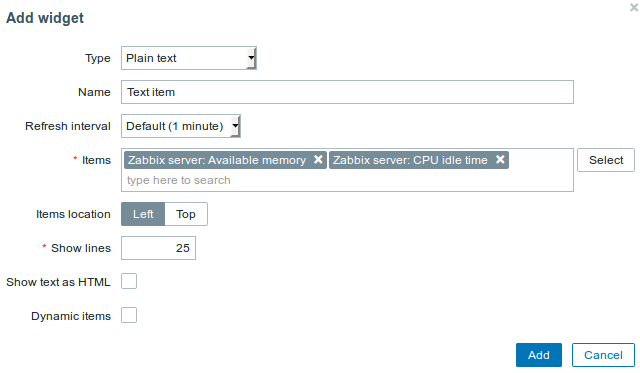
文本
在此小构件中,您可以以纯文本格式展示最新的项目数据
配置方法, 选择文本(Plain text) 类型:
 |
|---|
你还需要设置以下选项:
| 监控项 选择 | 应的监控项。 |
| 监控项位置 设置监控 | 的位置 |
| 展示行 设置 | 示多少行数据 |
| 查看HTML文字 展示H | ML文字 |
| 动态监控项 针对不同 | 机展示不同内容。 |
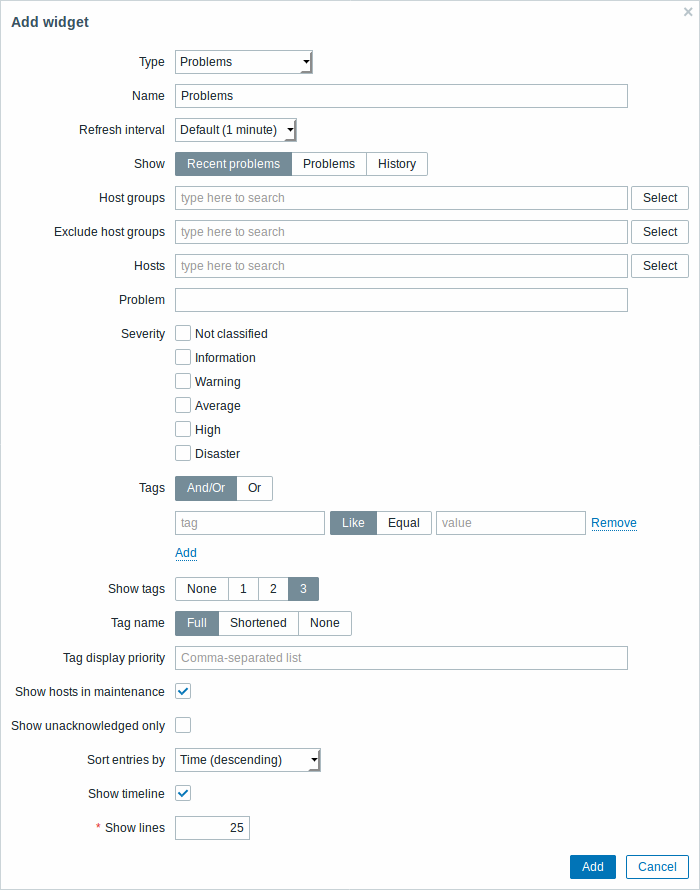
异常
在小构件中展示异常信息. 此构件中内容类似 监测中(Monitoring) → 异常(Problems).
配置方法,选择 异常(Problems) 类型:
 |
|---|
您可以通过各种方式限制窗口小部件中显示的问题数量 - 问题状态,问题名称,严重性,主机组,主机,事件标记,确认状态等。
| 参数类型 功能说 | |
|---|---|
| 查看 根 | 问题过滤,最近的问题:显示未解决的问题以及最近发生的问题。(默认选项);问题:显示所有未解决的问题。历史记录:显示所有事件记录 |
| 主机组 输入 | 机组以显示窗口小构件中的问题。 此字段是自动完成的,可以根据关键字快速搜索。\\指定父主机组会隐式选择所有嵌套的主机组。\\来自这些主机组的问题将显示在窗口小构件中。 如果留空,默认显示所有主机组问题。 |
| 排除主机组 输入要排 | 的主机组。 此字段是自动完成的,可以根据关键字快速搜索。\\指定父主机组会隐式选择所有嵌套的主机组。\\这些主机组中的问题不会显示在小构件。 例如,主机001,002,003也可以在组A中,并且主机002,003也可以在组B中。 如果我们选择显示组A和同时排除组B,则只有来自主机001的问题才会显示在窗口小构件中。 |
| 主机 E | ter hosts to display problems of in the widget. This field is auto-complete so starting to type the name of a host will offer a dropdown of matching hosts. If no hosts are entered, problems of all hosts will be displayed. |
| 监控项名称 You | an limit the number of problems displayed by their name. If you enter a string here, only those problems whose name LIKE matches the entered string will be displayed. Macros are not expanded. |
| 异常等级 Mar | the problem severities to be displayed in the widget. |
| 标签 S | ecify event tag name and value to limit the number of problems displayed. To add more event tag names and values, click on Add. There are two calculation types for several conditions: And/Or - all conditions must be met, conditions having same tag name will be grouped by Or condition Or - enough if one condition is met There are two ways of matching the tag value: Like - similar string match Equal - exact case-sensitive string match |
| Show tags | Select the number of displayed tags: None- no Tags column in Problems widget 1- Tags column contains one tag 2- Tags column contains two tags 3- Tags column contains three tags To see all tags for the problem roll your mouse over the three dots icon. |
| Show hosts in maintenance | Mark the checkbox to display problems of hosts in maintenance, too. |
| Show unacknowledged only | Mark the checkbox to display unacknowledged problems only. |
| Sort entries by | Sort entries by: Time (descending or ascending) Severity (descending or ascending) Problem name (descending or ascending) Host (descending or ascending). |
| Show timeline | Mark the checkbox to display a visual timeline. |
| Show lines | Specify the number of problem lines to display. |
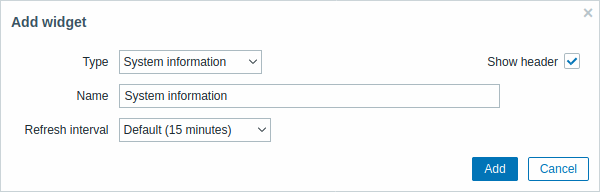
System information
In the System information widget you can display high-level Zabbix and Zabbix server information.
To configure, select System information as type:
 |
|---|
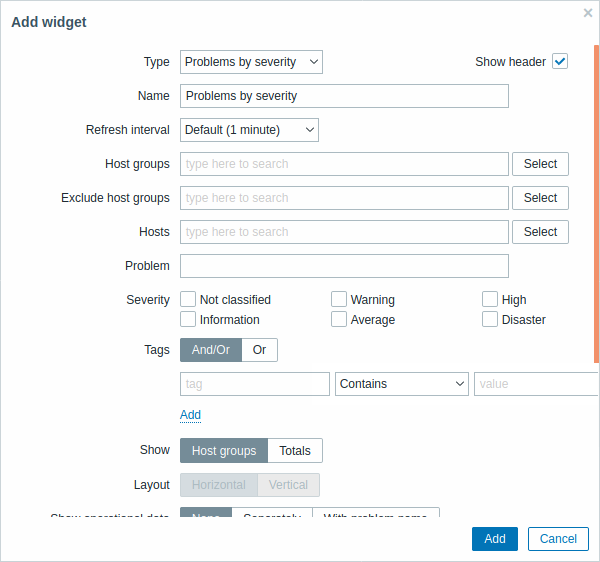
Problems by severity
In this widget you can display problems by severity. You can limit what hosts and triggers are displayed in the widget and define how the problem count is displayed.
To configure, select Problems by severity as type:
 |
|---|
You may set the following specific options:
| Parameter | Description |
|---|---|
| Host groups | Enter host groups to display in the widget. This field is auto-complete so starting to type the name of a group will offer a dropdown of matching groups. Specifying a parent host group implicitly selects all nested host groups. Host data from these host groups will be displayed in the widget. If no host groups are entered, all host groups will be displayed. |
| Exclude host groups | Enter host groups to hide from the widget. This field is auto-complete so starting to type the name of a group will offer a dropdown of matching groups. Specifying a parent host group implicitly selects all nested host groups. Host data from these host groups will not be displayed in the widget. For example, hosts 001, 002, 003 may be in Group A and hosts 002, 003 in Group B as well. If we select to show Group A and exclude Group B at the same time, only data from host 001 will be displayed in the Dashboard. |
| Hosts | Enter hosts to display in the widget. This field is auto-complete so starting to type the name of a host will offer a dropdown of matching hosts. If no hosts are entered, all hosts will be displayed. |
| Problem | You can limit the number of problem hosts displayed by the problem name. If you enter a string here, only those hosts with problems whose name LIKE matches the entered string will be displayed. Macros are not expanded. |
| Severity | Mark the problem severities to be displayed in the widget. |
| Show hosts in maintenance | Mark the Show hosts in maintenance option to display data from hosts in maintenance in the widget. |
| Hide groups without problems | Mark the Hide groups without problems option to hide data from host groups without problems in the widget. |
| Problem display | Display problem count as: All - full problem count will be displayed Separated - unacknowledged problem count will be displayed separated as a number of the total problem count Unacknowledged only - only the unacknowledged problem count will be displayed. |
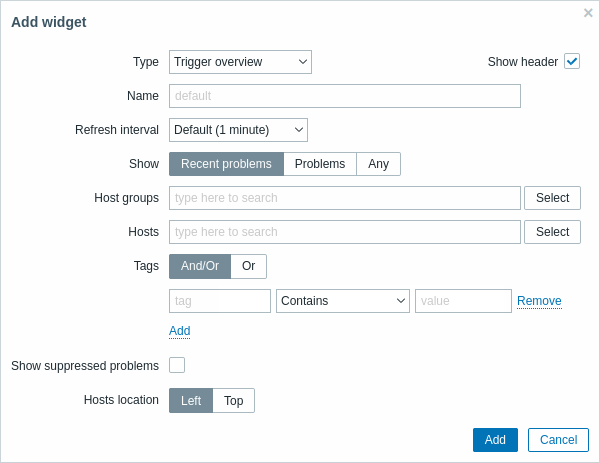
Trigger overview
In the trigger overview widget you can display the trigger states for a group of hosts. It replicates information from Monitoring → Overview (when Triggers is selected as Type there).
To configure, select Trigger overview as type:
 |
|---|
You may set the following specific options:
| Show | Filter by problem status: Recent problems - unresolved and recently resolved problems are displayed (default) Problems - unresolved problems are displayed Any - history of all events is displayed |
| Host groups | Select the host group(s). This field is auto-complete so starting to type the name of a group will offer a dropdown of matching groups. |
| Application | Enter the application name. |
| Hosts location | Select host location - left or top. |
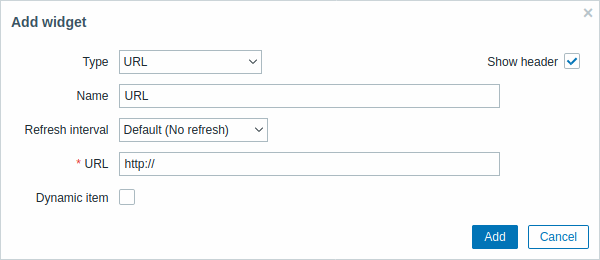
URL
In the URL widget you can display a URL content from an external resource.
To configure, select URL as type:
 |
|---|
You may set the following specific options:
| URL | Enter the URL to display. The URL must start with http://.{HOST.*} macros are supported. |
| Dynamic item | Set to display different URL content depending on the selected host. This can work if {HOST.*} macros are used in the URL. |
Browsers might not load an HTTP page included in the widget, if Zabbix frontend is accessed over HTTPS.
Web monitoring
This widget displays a status summary of the active web monitoring scenarios.
In cases when a user does not have permission to access certain widget elements, that element's name will appear as Inaccessible during the widget's configuration. This results in Inaccessible Item, Inaccessible Host, Inaccessible Group, Inaccessible Map and Inaccessible Graph appearing instead of the "real" name of the element.
URL
This widget displays the content retrieved from the specified URL.
To configure, select URL as type:
You may set the following specific options:
| URL | Enter the URL to display. Relative paths are allowed since Zabbix 4.4.8. {HOST.*} macros are supported. |
| Dynamic item | Set to display different URL content depending on the selected host. This can work if {HOST.*} macros are used in the URL. |
Browsers might not load an HTTP page included in the widget if Zabbix frontend is accessed over HTTPS.
Web monitoring
This widget displays a status summary of the active web monitoring scenarios.
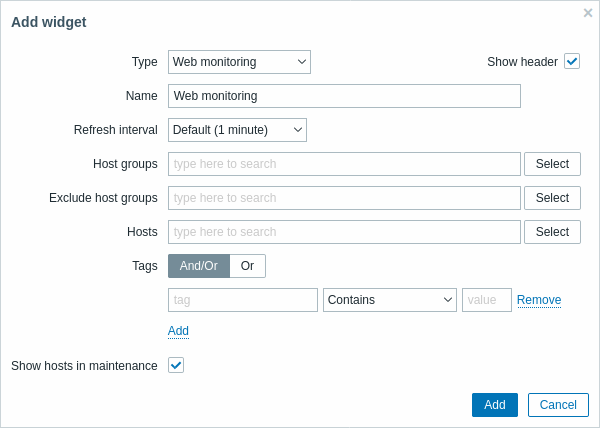
In cases when a user does not have permission to access certain widget elements, that element's name will appear as Inaccessible during the widget's configuration. This results in Inaccessible Item, Inaccessible Host, Inaccessible Group, Inaccessible Map, and Inaccessible Graph appearing instead of the "real" name of the element.
You may set the following specific options:
| Parameter | Description |
|---|---|
| Host groups | Enter host groups to display in the widget. This field is auto-complete so starting to type the name of a group will offer a dropdown of matching groups. Specifying a parent host group implicitly selects all nested host groups. Host data from these host groups will be displayed in the widget. If no host groups are entered, all host groups will be displayed. |
| Exclude host groups | Enter host groups to hide from the widget. This field is auto-complete so starting to type the name of a group will offer a dropdown of matching groups. Specifying a parent host group implicitly selects all nested host groups. Host data from these host groups will not be displayed in the widget. For example, hosts 001, 002, 003 may be in Group A and hosts 002, 003 in Group B as well. If we select to show Group A and exclude Group B at the same time, only data from host 001 will be displayed in the Dashboard. |
| Hosts | Enter hosts to display in the widget. This field is auto-complete so starting to type the name of a host will offer a dropdown of matching hosts. If no hosts are entered, all hosts will be displayed. |
| Tags | Specify tags to limit the number of web scenarios displayed in the widget. It is possible to include as well as exclude specific tags and tag values. Several conditions can be set. Tag name matching is always case-sensitive. There are several operators available for each condition: Exists - include the specified tag names Equals - include the specified tag names and values (case-sensitive) Contains - include the specified tag names where the tag values contain the entered string (substring match, case-insensitive) Does not exist - exclude the specified tag names Does not equal - exclude the specified tag names and values (case-sensitive) Does not contain - exclude the specified tag names where the tag values contain the entered string (substring match, case-insensitive) There are two calculation types for conditions: And/Or - all conditions must be met, conditions having the same tag name will be grouped by the Or condition Or - enough if one condition is met |
| Show hosts in maintenance | Include hosts that are in maintenance in the statistics. |