
1 常规设置
概述
管理 - >常规 部分包含多个用于设置前端相关默认值和自定义Zabbix的屏幕。
右侧的下拉菜单允许您在不同的配置屏幕之间切换。

- GUI
此屏幕提供了与前端相关的默认值的定制。
配置参数:
| 参数 描 | |
|---|---|
| 默认主题 没有在 | 个人资料中设置特定的用户的默认主题. |
| 下拉第一个入口 不管元素选择 | 拉列表中的第一个条目是 全部 或是 无. 并且勾选了记住所选项,当导航到另一个页面时,下拉列表中的最后一个选定的元素将被记住(而不是默认值)。 |
| 限制搜索和过滤结果 将在Web界面列 | 中显示的元素(行)的最大数量,例如,在监控 - >触发器或者 配置 - >主机. 注意: 如果设置为例如“50”,则前50个元素将仅显示在所有受影响的前端列表中。如果一些列表包含五十多个元素,那么它的指示将是“+” "显示** 50 + **发现中的1到50". 另外,如果使用过滤,并且仍然有超过50个匹配,则只显示前50个。 |
| 最大元素数\ 对于单个在表格内显示 | 格单元格中显示的条目,将不再显示此处配置的条目。 |
| 启用事件确认 此参数定义 | Zabbix界面中是否激活了事件确认 |
| 显示不久于..的时间\ 此参数定义在“于(天数) | 发器状态”屏幕中显示多少天事件。 默认为7天。 |
| 每个触发器显示的最大事件计数 触发状态屏幕中每个触发器的 | 大事件数。 默认值为100。 |
| 如果Zabbix服务器关闭,则显示警告 如果无法访问Zabbix | 务器(可能会关闭),此参数将使浏览器窗口中显示警告消息。 即使用户向下滚动页面,邮件仍然可见。 如果鼠标移过它,该信息将被暂时隐藏以显示下面的内容。 Zabbix 2.0.1之后的版本支持此参数。 |
- Housekeeper
家是由Zabbix服务器执行的定期流程。 该过程消除用户删除的过时信息和信息。
在本节中,内容任务可以单独启用或禁用每个任务: 事件和警报/ IT服务/审核/用户会话/历史/趋势。如果启用了家政管理,可以设置管理员被删除之前数据记录将保留多少天。
对于历史和趋势,还有其他选择: 覆盖项目历史记录周期 以及 覆盖项目趋势期. 此选项允许全局设置项目历史/趋势将保留多少天, 在这种情况下,覆盖项目配置中保留历史记录/保留趋势字段中各个项目的值集。
即使禁用内部管家,也可以覆盖历史/趋势存储期。因此,当使用外部管家时,可以使用历史记录数据存储期间字段设置历史存储期。
恢复默认值 按钮可以恢复所做的任何更改。
-图片
图像部分显示Zabbix中可用的所有图像。 图像存储在数据库中。
类型 下拉菜单允许您在图标和背景图像之间切换:
- 标用于显示网络图 元素
- 背景用作网络图的背景图像
添加图像
您可以通过点击右上角创建图标或者创建背景按钮添加自己的图像。
图像属性:
| 参数 描 | n |
|---|---|
| 名称 图 | 的唯一名称。 |
| 上传 从 | 地系统中选择要上传到Zabbix的文件(PNG,JPEG)。 |
上传文件的最大大小受ZBX_MAX_IMAGE_SIZE值的限制,为1024x1024字节或1
MB。
如果图像大小接近1
MB,“max_allowed_packet”的MySQL配置参数的默认值为1MB,则图像的上传可能会失败。在这种情况下,增加
max_allowed_packet
参数。
- 图标映射
本部分允许使用某些图标创建某些主机的映射。 主机清单字段信息用于创建映射。
然后可以使用映射网络地图配置 自动为匹配的主机分配适当的图标。
创建一个新的图标图, 点击右上角的 创建图标地图 。
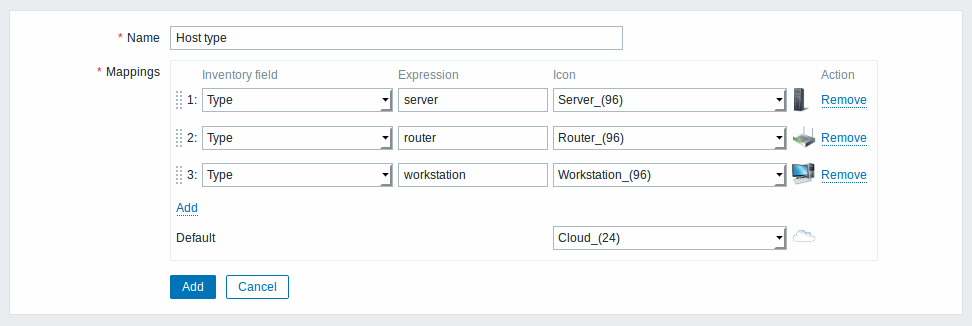
配置参数:
| 参数 描 | |
|---|---|
| 名称 图 | 地图的唯一名称。 |
| 映射 映 | 列表。 映射顺序决定哪一个优先级。 您可以使用拖放方式在列表上下移动映射。 |
| 库存字段 将要查 | 一个匹配的主机库存字段。 |
| 表达式 描述 | 配的正则表达式。 |
| 图标 如 | 找到表达式的匹配,则使用图标。 |
| 默认 要 | 用的默认图标。 |
- 正则表达式
此部分允许创建可在前端的多个位置使用的自定义正则表达式。参见正则表达式 细节。
- 宏
本节允许定义系统范围的宏。
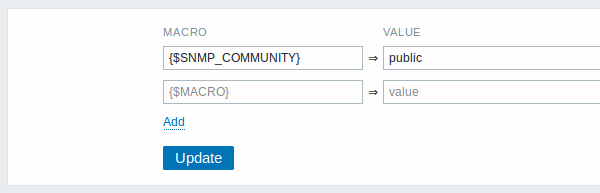
更多细节,参见用户宏。
- 值映射
本部分允许管理对于Zabbix前端中输入数据的可读表示有用的值映射。
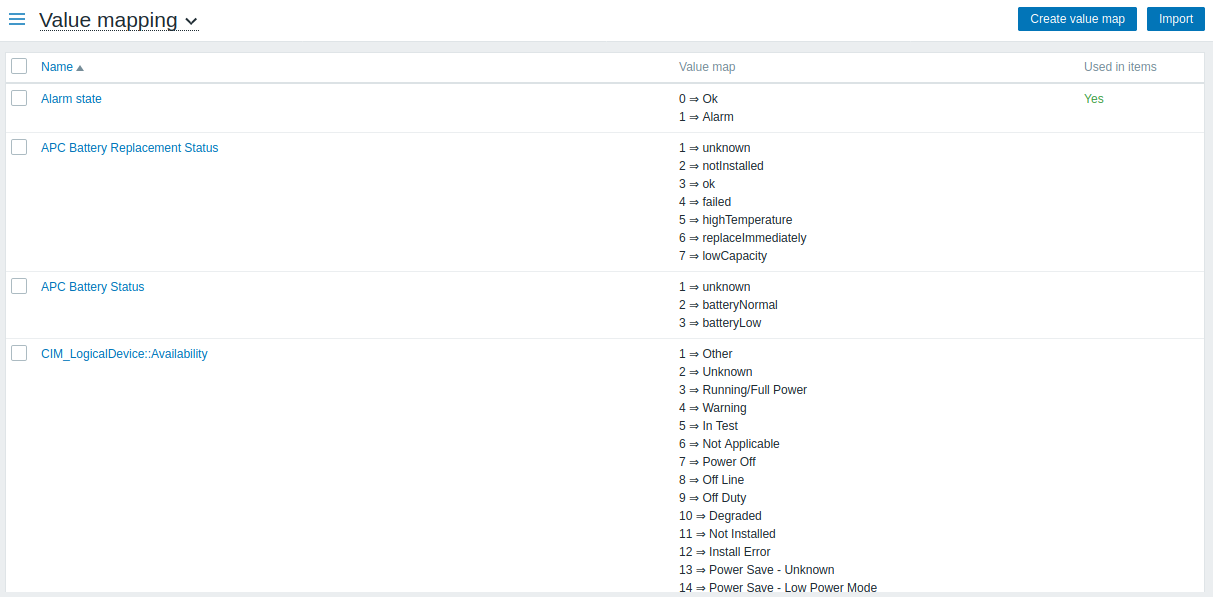
更多细节,参见值映射。
- 工作时间
工作时间是系统范围的参数,用于定义工作时间。 工作时间显示为图形中的白色背景,而非工作时间显示为灰色。
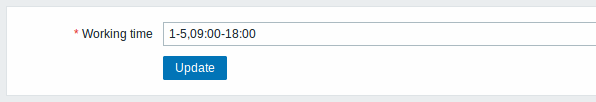
时间格式描述请参见时间段规格 页面。
-触发严重级
此部分允许自定义触发严重级名称和颜色
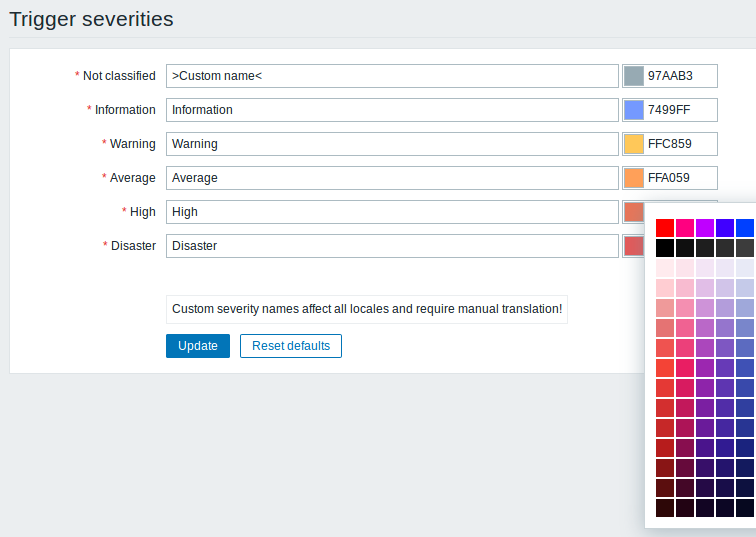
此部分允许自定义触发严重性您可以输入新的名称和颜色代码,或单击颜色以从提供的调色板中选择另一个。
更多信息,请参见 自定义触发严重级页面。
- 触发显示选项
此部分允许自定义触发状态在前端中的显示方式。
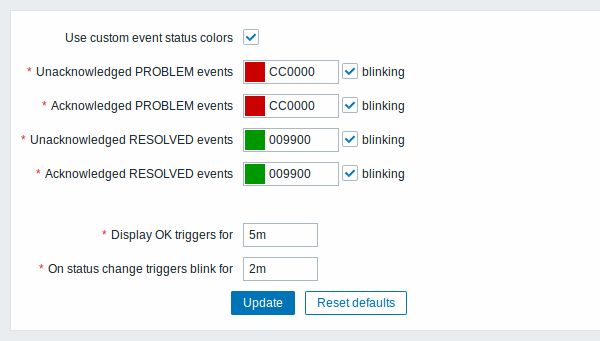
确认/未确认事件的颜色可以自定义并启用或禁用闪烁。
此外,可以定制显示OK触发的时间段和触发状态更改时的闪烁时间。 最大值为86400秒(24小时)。
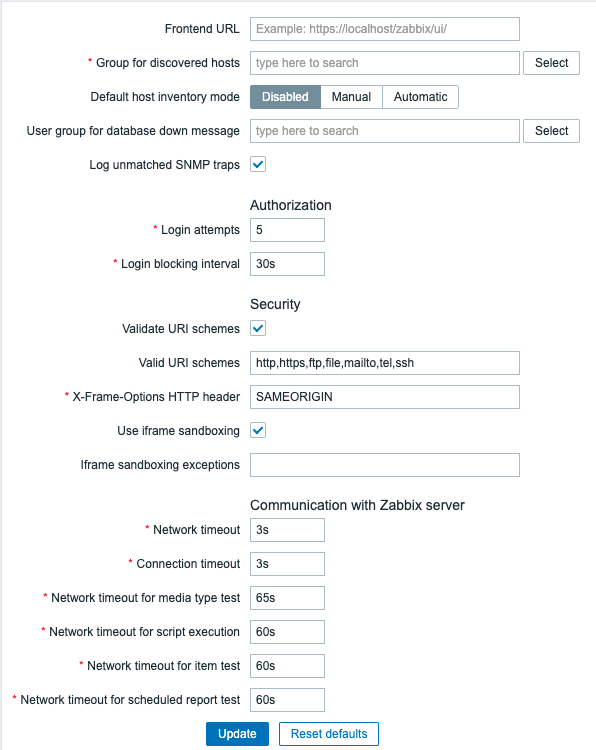
- 其他参数
此部分允许配置其他前端参数。
| 参数 描 | ||
|---|---|---|
| 刷新不支持项(以秒为单位) 由于用户参数错误或代理商 | 支持某些项目,某些项目可能会不受支持。Zabbix可以配置为定期使不受支持的项目处于活动状态。 Zabbix将在此处设置N秒钟激活不受支持的项目。 如果设置为0,则自动激活将被禁用。 代理检查每10分钟不支持的项目。 这是不可配置的代理。 |
|
| 发现主机组 被[网络 | 现](/manual/discovery/network_discovery) 和agent自动注册发现的主机 将自动放置在主机组中,此处选择。 | |
| 默认主机库存模式 主机库存默认 | 模式](/manual/config/hosts/inventory) 。 每当由服务器或前端创建新的主机或主机原型时都是可循的,除非在主机发现/自动注册中被//设置主机库存模式 选项覆盖。 | |数据库关闭消息的用户组// 用户组发送报警信息或“无”。 |
<Zabbix服务器的可用性取决于后端数据库的可用性。如果没有数据库,它不能工作。 Database watchdog, 一个特殊的Zabbix服务器进程,会在遇到灾难时对选定的用户进行报警。如果数据库关闭,watchdog将使用所有配置的用户媒体条目向此处设置的用户组发送通知。Zabbix服务器不会停止; 它将等到数据库再次重新继续处理。 Note: 直到Zabbix版本1.8.2数据库watchdog才支持MySQL。 自1.8.2以来,它支持所有数据库。 |
| Log unmatched SNMP traps | 如果没有找到相应的SNMP接口。查看日志 SNMP trap 。 | |
1 General
Overview
The Administration → General section contains a number of screens for setting frontend-related defaults and customizing Zabbix.
The dropdown to the right allows you to switch between different configuration screens.
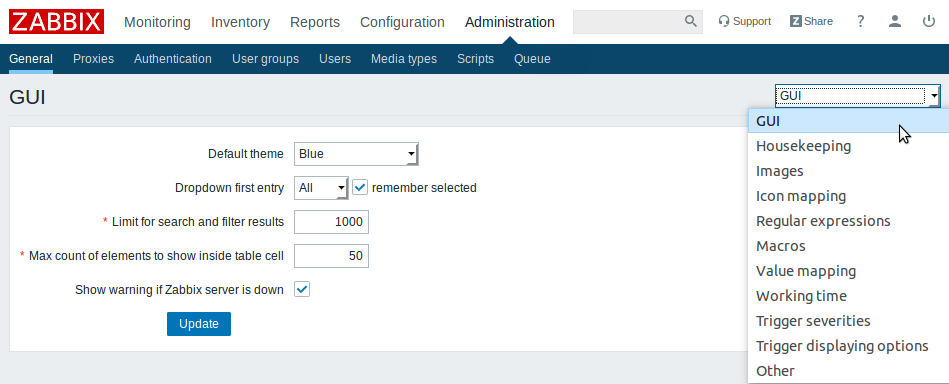
- GUI
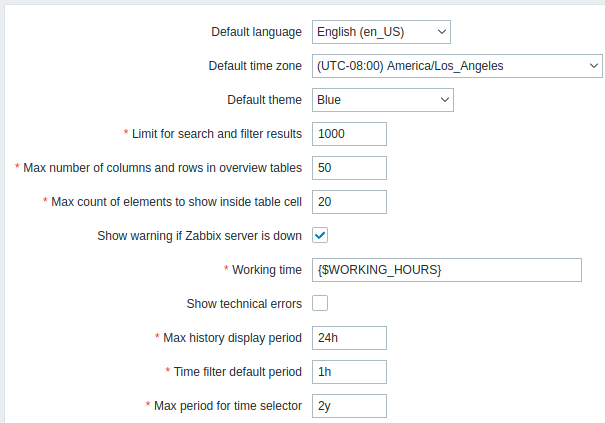
This screen provides customization of several frontend-related defaults.
Configuration parameters:
| Parameter | Description |
|---|---|
| Default theme | Default theme for users who have not set a specific one in their profiles. |
| Dropdown first entry | Whether first entry in element selection dropdowns should be All or None. With remember selected checked, the last selected element in the dropdown will be remembered (instead of the default) when navigating to another page. |
| Limit for search and filter results | Maximum amount of elements (rows) that will be displayed in a web-interface list, like, for example, in Configuration → Hosts. Note: If set to, for example, '50', only the first 50 elements will be displayed in all affected frontend lists. If some list contains more than fifty elements, the indication of that will be the '+' sign in "Displaying 1 to 50 of 50+ found". Also, if filtering is used and still there are more than 50 matches, only the first 50 will be displayed. |
| Max count of elements to show inside table cell |
For entries that are displayed in a single table cell, no more than configured here will be shown. |
| Show warning if Zabbix server is down | This parameter enables a warning message to be displayed in the browser window if Zabbix server cannot be reached (may be down). The message remains visible even if the user scrolls down the page. If the mouse is moved over it, the message is temporarily hidden to reveal the contents below. This parameter is supported since Zabbix 2.0.1. |
- Housekeeper
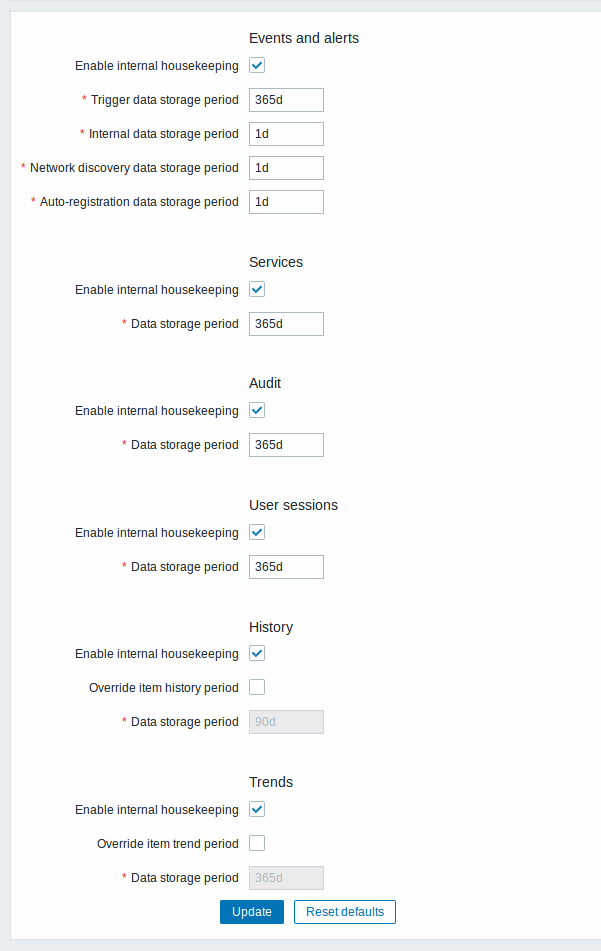
The housekeeper is a periodical process, executed by Zabbix server. The process removes outdated information and information deleted by user.
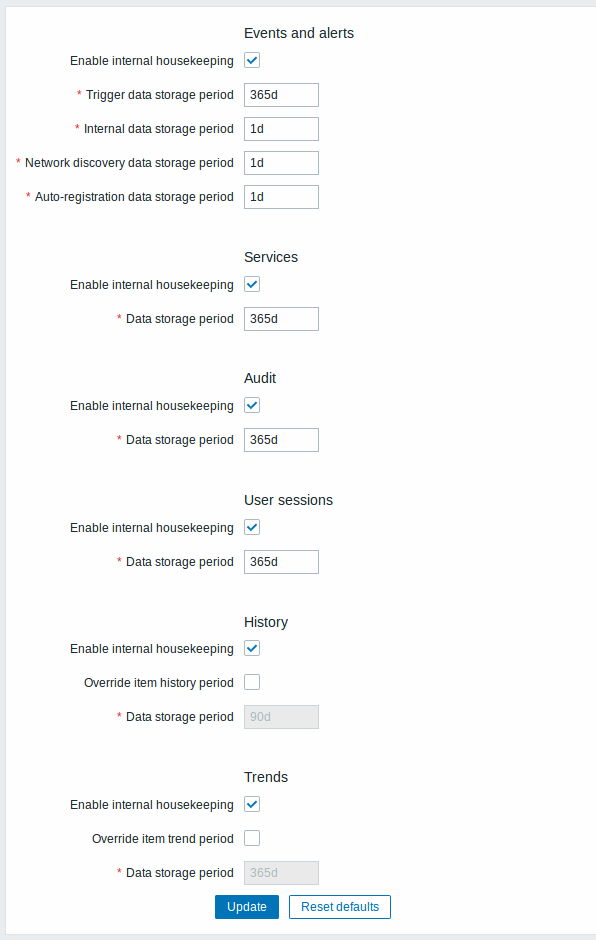
In this section housekeeping tasks can be enabled or disabled on a per-task basis separately for: events and alerts/IT services/audit/user sessions/history/trends. If housekeeping is enabled, it is possible to set for how many days data records will be kept before being removed by the housekeeper.
Deleting an item/trigger will also delete problems generated by that item/trigger.
Also, an event will only be deleted by the housekeeper if it is not associated with a problem in any way. This means that if an event is either a problem or recovery event, it will not be deleted until the related problem record is removed. The housekeeper will delete problems first and events after, to avoid potential problems with stale events or problem records.
For history and trends an additional option is available: Override item history period and Override item trends period. This option allows to globally set for how many days item history/trends will be kept, in this case overriding the values set for individual items in Keep history/Keep trends fields in item configuration.
It is possible to override the history/trend storage period even if internal housekeeping is disabled. Thus, when using an external housekeeper, the history storage period could be set using the history Data storage period field.
Time suffixes are supported in the period fields, e.g. 1d (one day), 1w (one week). Minimum is 1 day (1 hour for history), maximum 25 years.
Reset defaults button allows to revert any changes made.
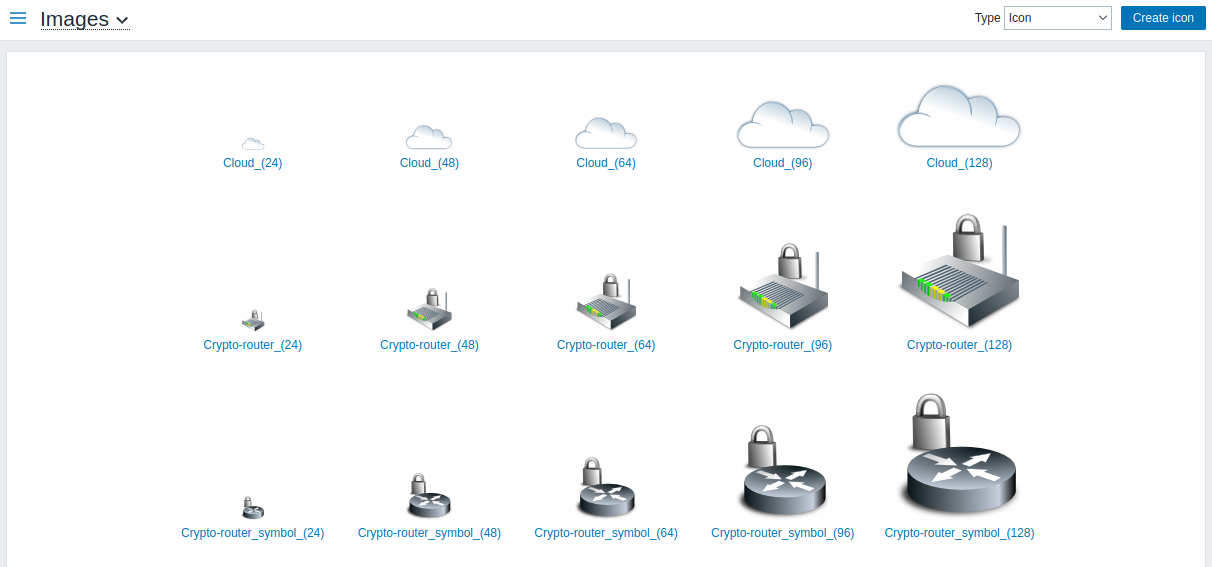
- Images
The Images section displays all the images available in Zabbix. Images are stored in the database.
The Type dropdown allows you to switch between icon and background images:
- Icons are used to display network map elements
- Backgrounds are used as background images of network maps
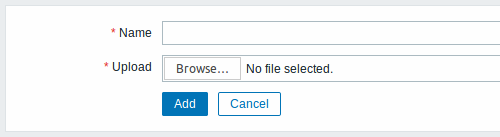
Adding image
You can add your own image by clicking on the Create icon or Create background button in the top right corner.
Image attributes:
| Parameter | Description |
|---|---|
| Name | Unique name of an image. |
| Upload | Select the file (PNG, JPEG) from a local system to be uploaded to Zabbix. |
Maximum size of the upload file is limited by value of
ZBX_MAX_IMAGE_SIZE that is 1024x1024 bytes or 1 MB.
The upload of an image may fail if the image size is close to 1 MB and
the max_allowed_packet MySQL configuration parameter is at a default
of 1MB. In this case, increase the
max_allowed_packet
parameter.
- Icon mapping
This section allows to create the mapping of certain hosts with certain icons. Host inventory field information is used to create the mapping.
The mappings can then be used in network map configuration to assign appropriate icons to matching hosts automatically.
To create a new icon map, click on Create icon map in the top right corner.
Configuration parameters:
| Parameter | Description |
|---|---|
| Name | Unique name of icon map. |
| Mappings | A list of mappings. The order of mappings determines which one will have priority. You can move mappings up and down the list with drag-and-drop. |
| Inventory field | Host inventory field that will be looked into to seek a match. |
| Expression | Regular expression describing the match. |
| Icon | Icon to use if a match for the expression is found. |
| Default | Default icon to use. |
- Regular expressions
This section allows to create custom regular expressions that can be used in several places in the frontend. See Regular expressions section for details.
- Macros
This section allows to define system-wide macros.
See User macros section for more details.
- Value mapping
This section allows to manage value maps that are useful for human-readable representation of incoming data in Zabbix frontend.
See Value mapping section for more details.
- Working time
Working time is system-wide parameter, which defines working time. Working time is displayed as a white background in graphs, while non-working time is displayed in grey.
See Time period specification page for description of the time format. User macros are supported (since Zabbix 3.4.0).
- Trigger severities
This section allows to customize trigger severity names and colors.
You can enter new names and color codes or click on the color to select another from the provided palette.
See Customising trigger severities page for more information.
- Trigger displaying options
This section allows to customize how trigger status is displayed in the frontend.

Checking "Use custom event status colors" checkbox enables customization of the colors for acknowledged/unacknowledged events. Unchecking this checkbox disables this customization, respectively. Blinking isn't affected by this checkbox.
Also the time period for displaying OK triggers and for blinking upon trigger status change can be customized. The maximum value is 86400 seconds (24 hours). Time suffixes are supported in the period fields, e.g. 5m, 2h, 1d.
- Other parameters
This section allows to configure several other frontend parameters.
| Parameter | Description |
|---|---|
| Refresh unsupported items | Some items may become unsupported due to errors in user parameters or because of an item not being supported by agent. Zabbix can be configured to periodically make unsupported items active. Zabbix server will activate unsupported item every N period set here (1 day maximum). If set to 0, the automatic activation will be disabled. Time suffixes are supported, e.g. 60s, 5m, 2h, 1d. The configured value also applies to how often Zabbix proxies reactivate unsupported items. |
| Group for discovered hosts | Hosts discovered by network discovery and agent auto-registration will be automatically placed in the host group, selected here. |
| Default host inventory mode | Default mode for host inventory. It will be followed whenever a new host or host prototype is created by server or frontend, unless overriden during host discovery/auto registration by the Set host inventory modeoperation. |
| User group for database down message | User group for sending alarm message or 'None'. Zabbix server depends on the availability of backend database. It cannot work without a database. If the database is down, selected users can be notified by Zabbix. Notifications will be sent to the user group set here using all configured user media entries. Zabbix server will not stop; it will wait until the database is back again to continue processing. Notification consists of the following content: [MySQL\|PostgreSQL\|Oracle\|IBM DB2] database <DB Name> [on <DB Host>:<DB Port>] is not available: <error message depending on the type of DBMS (database)><DB Host> is not added to the message if it is defined as an empty value and <DB Port> is not added if it is the default value ("0"). The alert manager (a special Zabbix server process) tries to establish a new connection to the database every 10 seconds. If the database is still down the alert manager repeats sending alerts, but not more often than every 15 minutes. |
| Log unmatched SNMP traps | Log SNMP trap if no corresponding SNMP interfaces have been found. |