
2 问题
简介
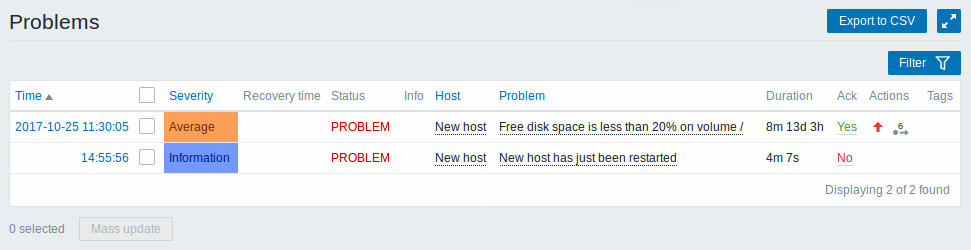
在 //监测中→问题中 //,你可看到当前存在什么问题。问题指处在“问题”状态下的触发器。
| 参数 功 | 说明 | |
|---|---|---|
| 时间(Time) 显示问 | 开始时间。 | |
| //严重等级(Severity) // 显示异 | 严重等级。\ 显示问题恢复时间。问题严重等级取决于其触发器的严重等级。触发器严重等级的颜色用作单元背景色。已处理过的问题,其背景颜色是绿色。在问题发生后,你可以使用// “确认事件” screen 更新问题 . | |恢复时间(Recovery time)// | |
| 状态(Status) 显示问 | 状态被显示为: 问题(Problem) - 未解决的问题 已恢复(Resolved) - 近期已解决问题.你可通过使用过滤器来隐藏近期已解决问题。 新解决的和近期解决的问题会闪烁2分钟。已解决问题共显示5分钟。触发器显示时间的配置在 管理 → 通用 → 触发器显示选项(Trigger displaying options). |
|
| 信息(Info) 如果通 | 全局关联关闭问题或在更新问题时手动显示绿色信息图标。 在图标上滚动鼠标将显示更多详细信息: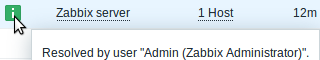 |
|
| 主机(Host) 显示异 | 的主机。 | |
| 问题(Problem) 显示问 | 名称。 问题名称取决于其触发器的问题名称。 |
|
| 持续时间(Duration) 显示问题持 | 时间 也可以参考这里: 异常问题持续时间 |
|
| 问题确认(ack) 显示问 | 确认状态: **已确认(Yes) ** - 绿色字体表明问题已确认。如果一项问题的所有事件都已被确认,则此项问题被认为已被确认。 未确认(NO) - 红色链接表明有未被确认的事件。 如果你点击链接将会被带到 问题确认 可以对显示的问题进行简单的处置。 |
|
| 动作(Actions) 使用符 | 标记有关问题的活动的历史记录: 当鼠标移动到图标时会显示当前的动作信息,更多内容请参见 查看详情 |
|
| 标记(Tags) [时间 | 签](/manual/config/triggers/event_tags) 显示时间标签 (如果存在)。 | |
负的问题持续时间
在某些情况下,可能会出现具有负的持续时间,即问题解决时间早于问题创建时间,例如:
- 在使用代理收集数据的时候,发生网络错误,导致代理暂时接收不到数据。同时主机触发器里有用到item.nodata()时,这时此触发器会自动触发。但等到链接恢复后,代理节点重新把积累数据传送给服务器时,问题将会得到解决。并且会出现负数的问题持续时间。;
- 当解决问题事件的项目数据由Zabbix发送并包含早于问题创建时间的时间戳时,还将显示负问题持续时间。
批量编辑选项
列表下方的按钮提供了一些批量编辑选项:
- 批量更新(Mass update) - 通过导航到问题来 更新问题(problem update) 屏幕
要使用此选项,请在出现相应问题之前选中复选框,然后单击 批量更新(Mass update) 按钮。
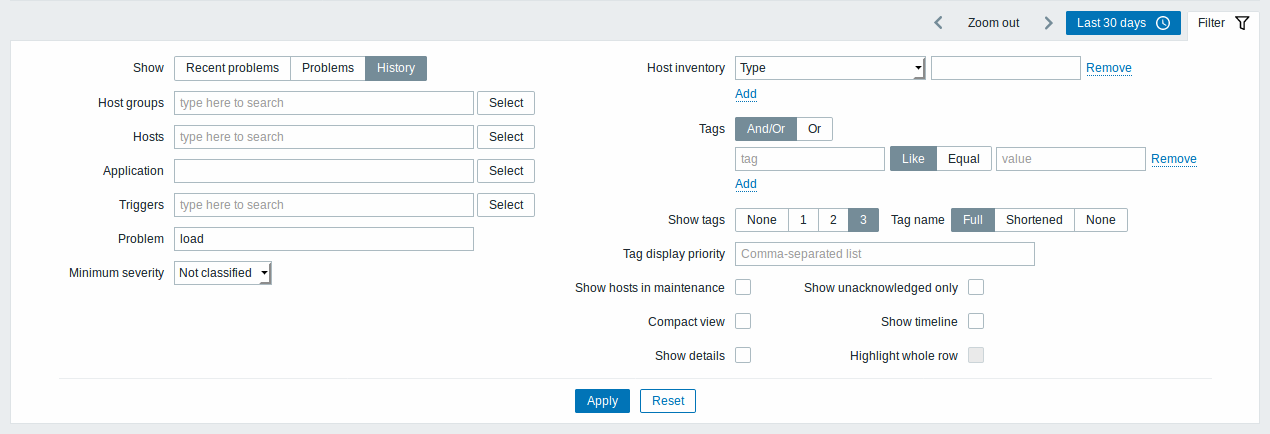
使用过滤器
您可以使用过滤器只显示你感兴趣的问题。过滤器位于目录上方。
| 参数 功 | 说明 |
|---|---|
| //显示(Show) // 按 | 题状态进行筛选: 最近的问题(Recent problems) - 显示未解决以及近期已解决异常 (默认) 问题(Problems) - 显示未解决的问题 历史记录(History) - 显示所有事件的历史记录 |
| //主机群组(Host Group) // 按一个 | 多个主机群组筛选。 指定一个父主机群组,指定一个父主机群组,隐式选择全部嵌套主机群组。 |
| 主机(Hosts) 按 | 个或多个主机进行筛选 。 |
| 应用集(Application) 按应用集 | 称筛选。 |
| 触发器(Triggers) 按一个或 | 个触发器筛选。 |
| 问题(Problem) 按问题 | 称筛选 。 |
| //最低触发器严重等级(Minimum trigger severity) // 按最低触发器严重 | 级筛选。 |
| //主机资产记录(Host inventory) // 按资产记录 | 型和值进行筛选。 |
| //标签(Tags) // 按 | 件标签名称和值进行筛选。 可以设置多个条件,条件中可以增加判断。 和(And)/或者(Or) - 必须满足所有条件,具有相同标签名称的条件将按Or条件分组 或者(Or) - 满足其中一条即可。 匹配表标记值的方法有两种: (类似)Like - 模糊类型的字段匹配 等于(Equal) - 精确匹配 |
| 显示标签(Show tags) 选择显示的 | 签数量: 无或空(None)- 没有 标签 的监控问题 监测 → 问题 1- 标签 列包含一个标签 2- 标签 列包含两个标签 3- 标签 栏包含三个标签 要查看问题的所有标记,请将鼠标悬停在三个点图标上。 |
| //显示维护中的主机异常(Show hosts in maintenance) // 标记复选框,以显示 | 护中的主机异常。 |
| 精简视图(Compact view) 选中复选框 | 启用精简、紧凑视图。 |
| 展示详细信息(Show details) 选中复选框以显 | 问题的基础触发表达式。 需要禁用精简视图(Compact view)。 |
| //仅显示未确认的异常(Show unacknowledged only) // 标记复选框,仅显 | 未确认的异常。 |
| 时间轴显示(Show timeline) 选中复选框以 | 示可视时间轴和分组。需要禁用精简视图(Compact view)。 |
| 整行突出显示(Highlight whole row) 选中复选框以突 | 显示未解决问题的完整行。 问题严重性颜色用于突出显示。 仅在官方蓝色、黑色的主题中使用精简视图并启用。高对比度主题中无法突出显示整行。 |
查看详细信息
在 监测 → 问题 异常开始和恢复的时间都有链接,单击链接可以打开更多事件细节。

触发器和问题时间的严重性是有区别的。问题事件需要到 问题确认中 进行更新。细节
在操作列表中,以下图标用于表示活动类型:
 -
生成问题事件
-
生成问题事件 -
信息已发送
-
信息已发送 -
已确认问题事件
-
已确认问题事件 -
有评论添加
-
有评论添加 -
问题严重程度已经升级 (例如: 信息 → 警告)
-
问题严重程度已经升级 (例如: 信息 → 警告) -
问题严重度已经下降 (e.g. 警告 → 信息)
-
问题严重度已经下降 (e.g. 警告 → 信息) -
问题严重性发生变化,回到初始问题级别。 (例如: (最初为)警告级别 →
(降级为)信息级别→ (又升级为)警告级别)
-
问题严重性发生变化,回到初始问题级别。 (例如: (最初为)警告级别 →
(降级为)信息级别→ (又升级为)警告级别) -
执行了远程命令
-
执行了远程命令 -
问题事件已恢复
-
问题事件已恢复 -
问题被手动关闭
-
问题被手动关闭
Using filter
You can use the filter to display only the problems you are interested in. For better search performance, data is searched with macros unresolved.
The filter is located above the table. Favorite filter settings can be saved as tabs and then quickly accessed by clicking on the tabs above the filter.
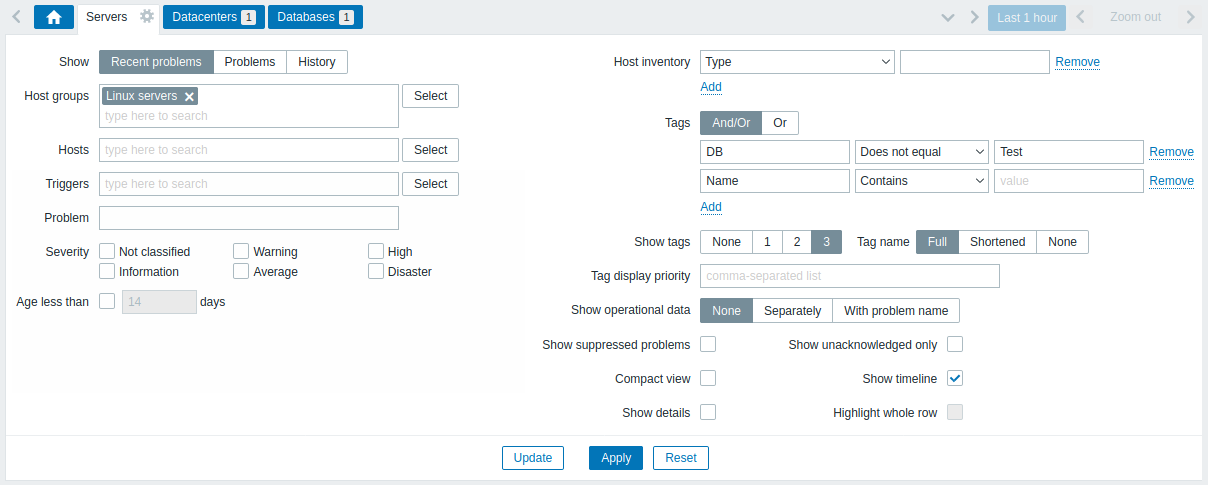
| Parameter | Description |
|---|---|
| Show | Filter by problem status: Recent problems - unresolved and recently resolved problems are displayed (default) Problems - unresolved problems are displayed History - history of all events is displayed |
| Host groups | Filter by one or more host groups. Specifying a parent host group implicitly selects all nested host groups. |
| Hosts | Filter by one or more hosts. |
| Triggers | Filter by one or more triggers. |
| Problem | Filter by problem name. |
| Severity | Filter by trigger (problem) severity. |
| Age less than | Filter by how old the problem is. |
| Host inventory | Filter by inventory type and value. |
| Tags | Filter by event tag name and value. It is possible to include as well as exclude specific tags and tag values. Several conditions can be set. Tag name matching is always case-sensitive. There are several operators available for each condition: Exists - include the specified tag names Equals - include the specified tag names and values (case-sensitive) Contains - include the specified tag names where the tag values contain the entered string (substring match, case-insensitive) Does not exist - exclude the specified tag names Does not equal - exclude the specified tag names and values (case-sensitive) Does not contain - exclude the specified tag names where the tag values contain the entered string (substring match, case-insensitive) There are two calculation types for conditions: And/Or - all conditions must be met, conditions having the same tag name will be grouped by the Or condition Or - enough if one condition is met When filtered, the tags specified here will be displayed first with the problem, unless overridden by the Tag display priority (see below) list. |
| Show tags | Select the number of displayed tags: None - no Tags column in Monitoring → Problems 1 - Tags column contains one tag 2 - Tags column contains two tags 3 - Tags column contains three tags To see all tags for the problem roll your mouse over the three dots icon. |
| Tag name | Select tag name display mode: Full - tag names and values are displayed in full Shortened - tag names are shortened to 3 symbols; tag values are displayed in full None - only tag values are displayed; no names |
| Tag display priority | Enter tag display priority for a problem, as a comma-separated list of tags (for example: Services,Applications,Application). Tag names only should be used, no values. The tags of this list will always be displayed first, overriding the natural ordering by alphabet. |
| Show operational data | Select the mode for displaying operational data: None - no operational data is displayed Separately - operational data is displayed in a separate column With problem name - append operational data to the problem name, using parentheses for the operational data |
| Show suppressed problems | Mark the checkbox to display problems that would otherwise be suppressed (not shown) because of host maintenance. |
| Compact view | Mark the checkbox to enable compact view. |
| Show details | Mark the checkbox to display underlying trigger expressions of the problems. Disabled if Compact view checkbox is marked. |
| Show unacknowledged only | Mark the checkbox to display unacknowledged problems only. |
| Show timeline | Mark the checkbox to display the visual timeline and grouping. Disabled if Compact view checkbox is marked. |
| Highlight whole row | Mark the checkbox to highlight the full line for unresolved problems. The problem severity color is used for highlighting. Enabled only if the Compact view checkbox is marked in the standard blue and dark themes. Highlight whole row is not available in the high-contrast themes. |
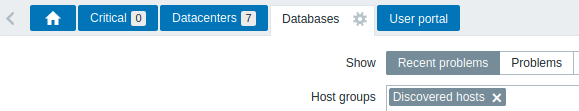
Tabs for favorite filters
Frequently used sets of filter parameters can be saved in tabs.
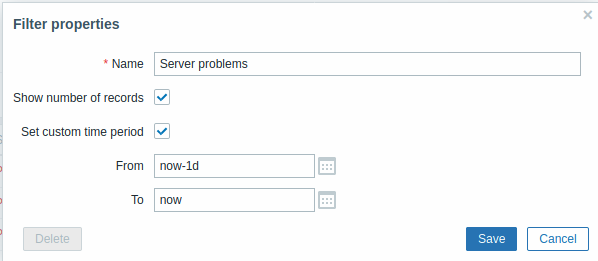
To save a new set of filter parameters, open the Home tab, and configure the filter settings, then press the Save as button. In a new popup window, define Filter properties.
| Parameter | Description |
|---|---|
| Name | The name of the filter to display in the tab list. |
| Show number of records | Check, if you want the number of problems to be displayed next to the tab name. |
| Set custom time period | Check to set specific default time period for this filter set. If set, you will only be able to change the time period for this tab by updating filter settings. For tabs without a custom time period, the time range can be changed by pressing the time selector button in the top right corner (button name depends on selected time interval: This week, Last 30 minutes, Yesterday, etc.). This option is available only for filters in Monitoring→Problems. |
| From/To | Time period start and end in absolute (Y-m-d H:i:s) or relative time syntax (now-1d). Available, if Set custom time period is checked. |
To edit Filter properties of an existing filter, press the gear symbol next to the active tab name.
Notes:
- To hide a filter, press on the name of the current tab. Press on the active tab name again to open the filter.
- Filter tabs can be re-arranged by dragging and dropping.
- Keyboard navigation is supported: use arrows to switch between tabs, press Enter to open.
- Pressing the arrow down icon in the upper right corner will open the full list of saved filter tabs as a drop-down menu.
To share filters, copy and send to others a URL of an
active filter. After opening this URL, other users will be able to save
this set of parameters as a permanent filter in their Zabbix account.
See also: Page
parameters.
Filter buttons
 |
Apply specified filtering criteria (without saving). |
 |
Reset current filter and return to saved parameters of the current tab. On the Home tab, this will clear the filter. |
 |
Save current filter parameters in a new tab. Only available on the Home tab. |
 |
Replace tab parameters with currently specified parameters. Not available on the Home tab. |
Event menu
Clicking on the problem name brings up the event menu:
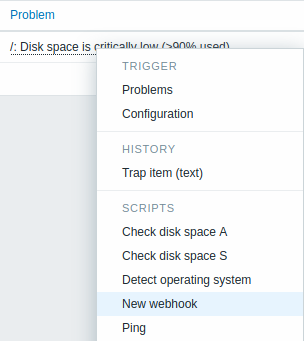
The event menu allows to:
- filter the problems of the trigger
- access the trigger configuration
- access a simple graph/item history of the underlying item(s)
- access an external ticket of the problem (if configured, see the Include event menu entry option when configuring webhooks)
- execute global scripts (these scripts need to have their scope defined as 'Manual event action'). This feature may be handy for running scripts used for managing problem tickets in external systems.
Viewing details
The times for problem start and recovery in Monitoring → Problems are links. Clicking on them opens more details of the event.
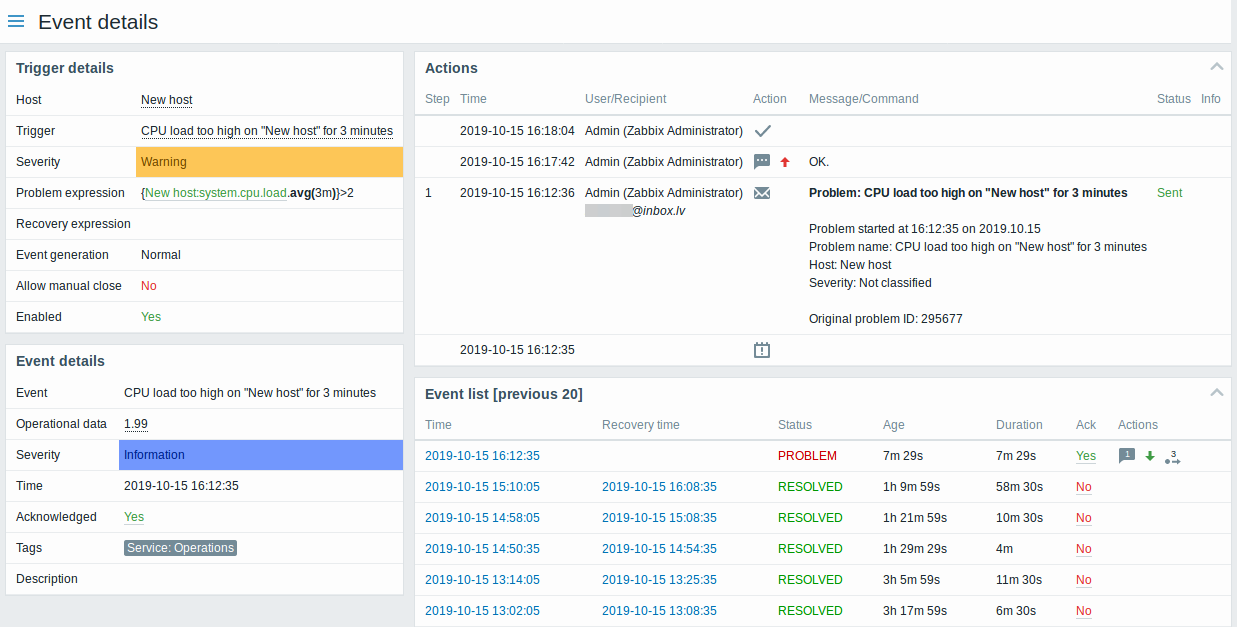
Note how the problem severity differs for the trigger and the problem event - for the problem event it has been updated using the Update problem screen.
In the action list, the following icons are used to denote the activity type:
- -
problem event generated
- -
message has been sent
- -
problem event acknowledged
 -
problem event unacknowledged
-
problem event unacknowledged- -
a comment has been added
- -
problem severity has been increased (e.g. Information → Warning)
- -
problem severity has been decreased (e.g. Warning → Information)
- -
problem severity has been changed, but returned to the original
level (e.g. Warning → Information → Warning)
- -
a remote command has been executed
- -
problem event has recovered
- -
the problem has been closed manually