
11 Monitor Windows event log using active checks
Introduction
This guide explains how to monitor Windows event logs with Zabbix using active checks. With Zabbix Windows-specific item keys, you can collect and analyze critical events (such as failed logon attempts, system errors, etc.) in real time.
Who this guide is for
This guide is designed for new Zabbix users and network administrators who want to monitor Windows event logs. For advanced configuration options, refer to the Windows-specific item keys documentation.
Prerequisites
Before proceeding with this guide, you need to download and install Zabbix server and Zabbix frontend according to the instructions for your OS. You also need Zabbix agent downloaded and installed on the Windows machine you want to monitor.
Configure Zabbix agent for Windows event log monitoring
1. Open zabbix_agentd.conf (default path C:\Program Files\Zabbix Agent\zabbix_agentd.conf) on your Windows host and ensure that the ServerActive parameter is set to the IP address of your Zabbix server, and the Hostname parameter matches the host name that will be defined in Zabbix frontend. This enables the agent to request active checks for its host and from the specified Zabbix server. For example:
ServerActive=192.0.2.1
Hostname=MyWindowsHost
2. Restart Zabbix agent service to apply the changes:
net stop "Zabbix Agent" && net start "Zabbix Agent"3. Check that the Windows host is running:
- Ensure Zabbix agent service is running on the Windows host.
- Check that the Windows host can connect to Zabbix server on port 10051. To test connectivity from the Windows host, open PowerShell and run the following command:
Test-NetConnection -ComputerName <Zabbix-server-IP> -Port 10051Configure Zabbix frontend
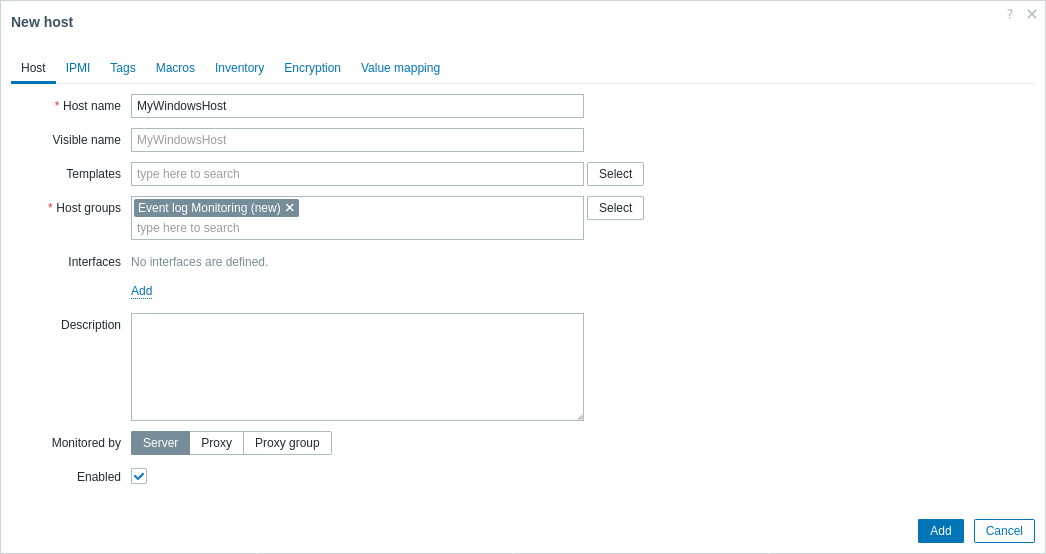
1. Navigate to Data collection > Hosts and create a host:
- In the Host name field, enter a host name (e.g., "MyWindowsHost").
- In the Host groups field, type or select a host group (e.g., "Event log Monitoring").
- Click Add to save the configured host.
In the Templates field you may add the "Windows by Zabbix agent active" template to help you troubleshoot by observing whether other active items on the same host are updating.
2. Create a new item with the following parameters:
- In the Name field, enter a descriptive item name (e.g., "Security log: failed logon events").
- In the Type drop-down, select "Zabbix agent (active)" (required for Event log monitoring).
- In the Key field, use the eventlog item key. For example, to monitor failed logon attempts (Event ID: 4625) in the Security log and to ignore entries older than the item's last check (using the
skipparameter), enter the following item key:eventlog[Security,,,,4625,,skip] - In the Type of information drop-down, select "Log".
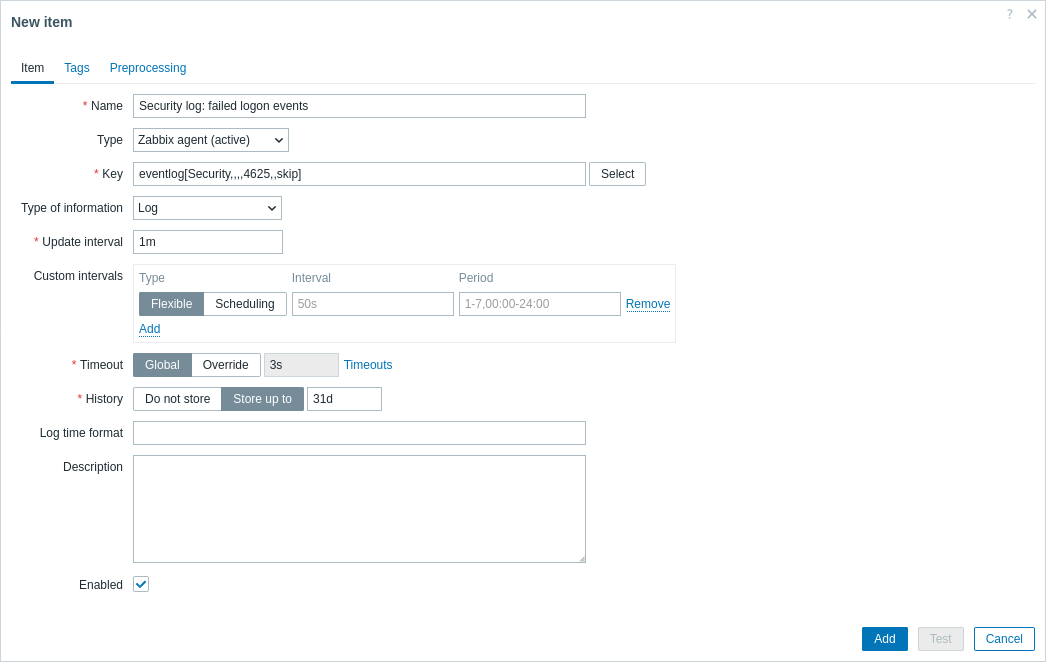
3. Click Add to save the item.
Test and view collected metrics
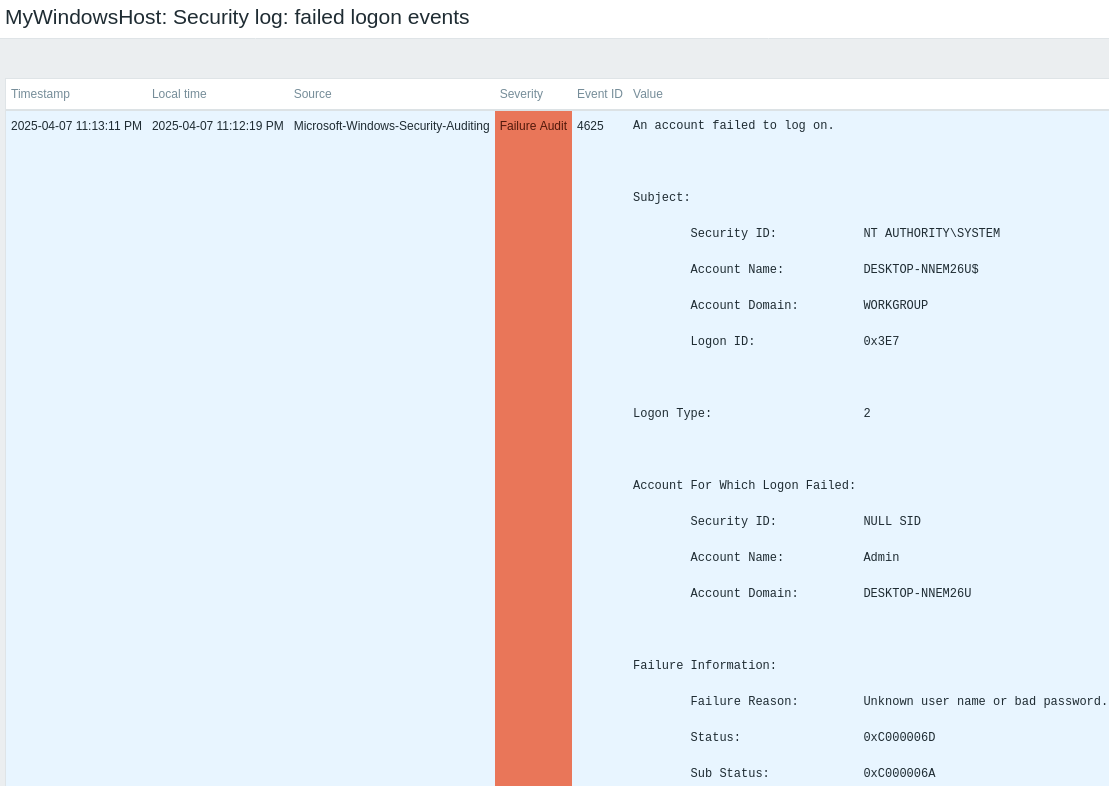
Congratulations! Zabbix is now set up to collect your Windows event logs. To verify that event logs are being collected, you can test the "Security log: failed logon events" item by logging out of your Windows account and attempting to log in using incorrect credentials.
Then, view the collected logs in Zabbix frontend:
1. Navigate to Monitoring > Latest data in Zabbix frontend.
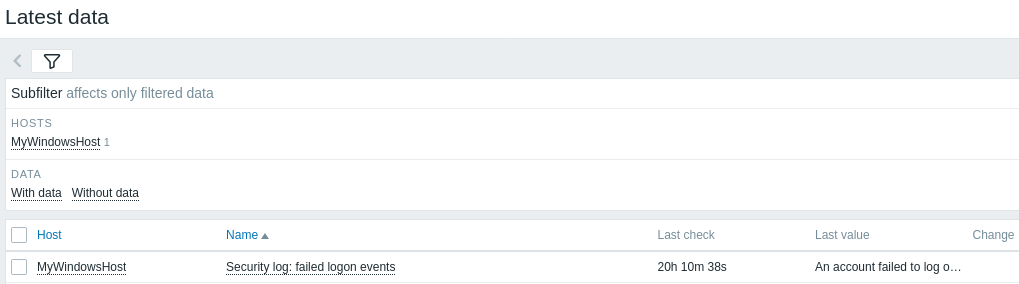
2. Filter by your "MyWindowsHost" host in the Name field.
3. Click History to view recorded log values.
4. If log values are absent, proceed to the Troubleshooting section of the guide.
Set up problem alerts
This guide provides basic configuration steps for sending email alerts.
1. Navigate to Data collection > Hosts to define a trigger that fires when your event log item records the pattern you care about. For example, to catch failed logon attempts in the Security log, use the find() function:
find(/MyWindowsHost/eventlog[Security,,,,4625,,skip],10m,"like","Logon failed")
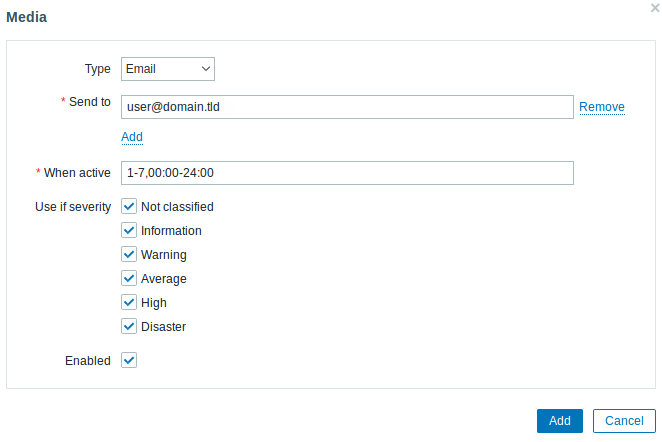
2. Navigate to User settings > Profile, switch to the Media tab and add your email.
3. Follow the guide for Receiving a problem notification.
Next time, when Zabbix detects a problem, you should receive an alert via email.
Troubleshooting
If you encounter issues with collecting or viewing Windows event logs, use the tips below to identify and resolve common problems:
1. On Zabbix server (Linux) list your iptables rules with the following command:
sudo iptables -L -nand verify there's an ACCEPT rule for TCP port 10051.
2. Make sure your eventlog[...] key uses the exact log name (case-sensitive), event ID, mode (e.g. skip) and other parameters exactly as shown in the Windows-specific item keys.
See also:
- Creating an item - learn how to add additional metrics.
- Zabbix agent on Microsoft Windows - detailed installation instructions.
- Monitor Windows with Zabbix agent - a comprehensive guide on setting up basic monitoring for Windows machines using Zabbix agent.
- Windows-specific item keys - detailed information on Windows-specific item keys supported by Zabbix agents, including those for event log monitoring.
- Log file monitoring - instructions on configuring Zabbix for centralized monitoring and analysis of log files, applicable to Windows event logs.