
2 SLA
Overview
Once the services are created, you can start monitoring whether their performance is on track with service level agreement (SLA).
Services->SLA menu section allows to configure SLAs for various services. An SLA in Zabbix defines service level objective (SLO), expected uptime schedule and planned downtimes.
SLAs and services are matched by service tags. The same SLA may be applied to multiple services - performance will be measured for each matching service separately. A single service may have multiple SLAs assigned - data for each of the SLAs will be displayed separately.
In SLA reports Zabbix provides Service level indicator (SLI) data, which measures real service availability. Whether a service meets the SLA targets is determined by comparing SLO (expected availability in %) with SLI (real-life availability in %).
Configuration
To create a new SLA, click the Create SLA button.
The SLA tab allows to specify general SLA parameters.
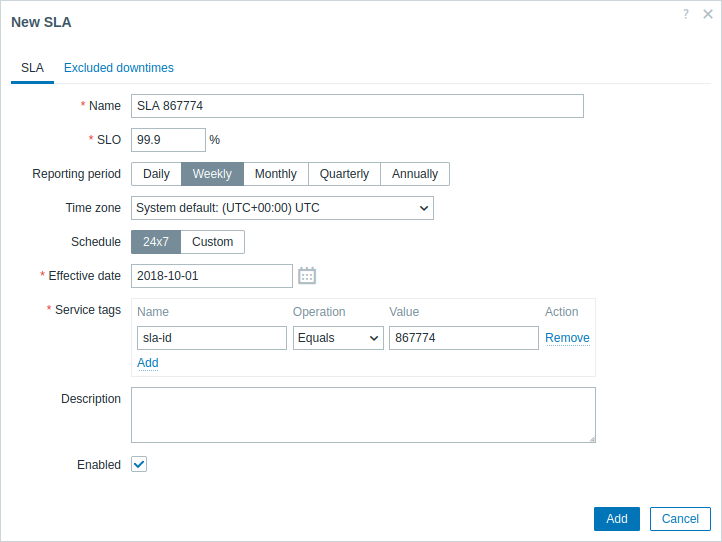
| Parameter | Description |
|---|---|
| Name | Enter the SLA name. |
| SLO | Enter the service level objective (SLO) as percentage. |
| Reporting period | Select the SLI reporting period used for calculating the SLI data in the SLA report: Daily - each day, from 00:00:00 to 23:59:59. Weekly - each week, from Sunday 00:00:00 to Saturday 23:59:59. Monthly - each month, from the first day 00:00:00 to the last day 23:59:59. Quarterly - each calendar quarter: Q1 (Jan-Mar), Q2 (Apr-Jun), Q3 (Jul-Sep), Q4 (Oct-Dec). Annually - each calendar year, from January 1 00:00:00 to December 31 23:59:59. |
| Time zone | Select the SLA time zone. |
| Schedule | Select the SLA schedule - 24x7 or custom. |
| Effective date | Select the date of starting SLA calculation. |
| Service tags | Add service tags to identify the services towards which this SLA should be applied. Name - service tag name, must be exact match, case-sensitive. Operation - select Equals if the tag value must match exactly (case-sensitive) or Contains if part of the tag value must match (case-insensitive). Value - service tag value to search for according to selected operation. The SLA is applied to a service, if at least one service tag matches. |
| Description | Add a description for the SLA. |
| Enabled | Mark the checkbox to enable the SLA calculation. |
The Excluded downtimes tab allows to specify downtimes that are excluded from the SLA calculation.
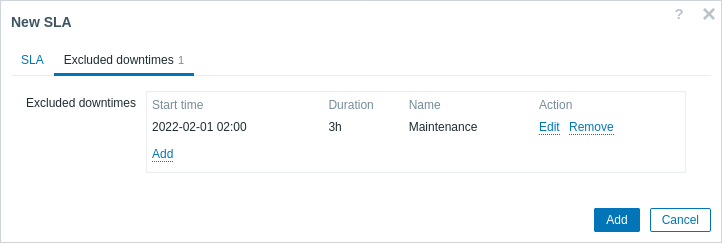
Click Add to configure excluded downtimes, then enter the period name, start date and duration.
SLA reports
How a service performs compared to an SLA is visible in the SLA report. SLA reports can be viewed:
- from the SLA section by clicking the SLA report hyperlink;
- from the Services section by clicking the SLA name in the info tab;
-
in the Dashboard widget SLA report.
Once an SLA is configured, the Info tab in the services section will also display some information about service performance.