
4 Monitorare MySQL con Zabbix agent 2
Introduzione
Questa pagina illustra i passaggi necessari per avviare il monitoraggio di base di un server MySQL.
Per monitorare un server MySQL, esistono diversi approcci: Zabbix agent, Zabbix agent 2 oppure lo standard Open Database Connectivity (ODBC). L'obiettivo principale di questa guida è il monitoraggio di un server MySQL con Zabbix agent 2, che rappresenta l'approccio consigliato grazie alla sua configurazione semplice e uniforme in vari scenari. Tuttavia, questa pagina fornisce anche istruzioni per gli altri approcci, quindi sentiti libero di scegliere quello più adatto alle tue esigenze.
A chi è rivolta questa guida
Questa guida è pensata per i nuovi utenti di Zabbix e contiene il set minimo di passaggi necessari per abilitare il monitoraggio di base di un server MySQL. Se stai cercando opzioni di personalizzazione approfondite o hai bisogno di una configurazione più avanzata, consulta la sezione Configuration del manuale di Zabbix.
Prerequisiti
Prima di procedere con questa guida, è necessario scaricare e installare Zabbix server, Zabbix frontend e Zabbix agent 2 in base alle istruzioni per il proprio sistema operativo.
A seconda dell'ambiente in uso, alcuni passaggi di questa guida potrebbero differire leggermente. Questa guida si basa su un ambiente che esegue Ubuntu.
Creare un utente MySQL
Per monitorare un server MySQL, Zabbix richiede l'accesso a esso e ai suoi processi. La tua installazione MySQL dispone già di un utente con il livello di accesso richiesto (l'utente "zabbix" creato durante l'installazione di Zabbix), tuttavia questo utente ha più privilegi del necessario per il semplice monitoraggio (privilegi per eseguire il DROP dei database, eliminare voci dalle tabelle, ecc.). Pertanto, è necessario creare un utente MySQL con il solo scopo di monitorare il server MySQL.
1. Connettiti al client MySQL, crea un utente "zbx_monitor" (sostituisci <password> dell'utente "zbx_monitor" con una password a tua scelta), e GRANT i privilegi necessari all'utente:
mysql -u root -p
# Inserisci la password:

mysql> CREATE USER 'zbx_monitor'@'%' IDENTIFIED BY '<password>';
mysql> GRANT REPLICATION CLIENT,PROCESS,SHOW DATABASES,SHOW VIEW ON *.* TO 'zbx_monitor'@'%';
mysql> quit;
Una volta creato l'utente, puoi passare al passaggio successivo.
Configurare il frontend di Zabbix
1. Accedi al frontend di Zabbix.
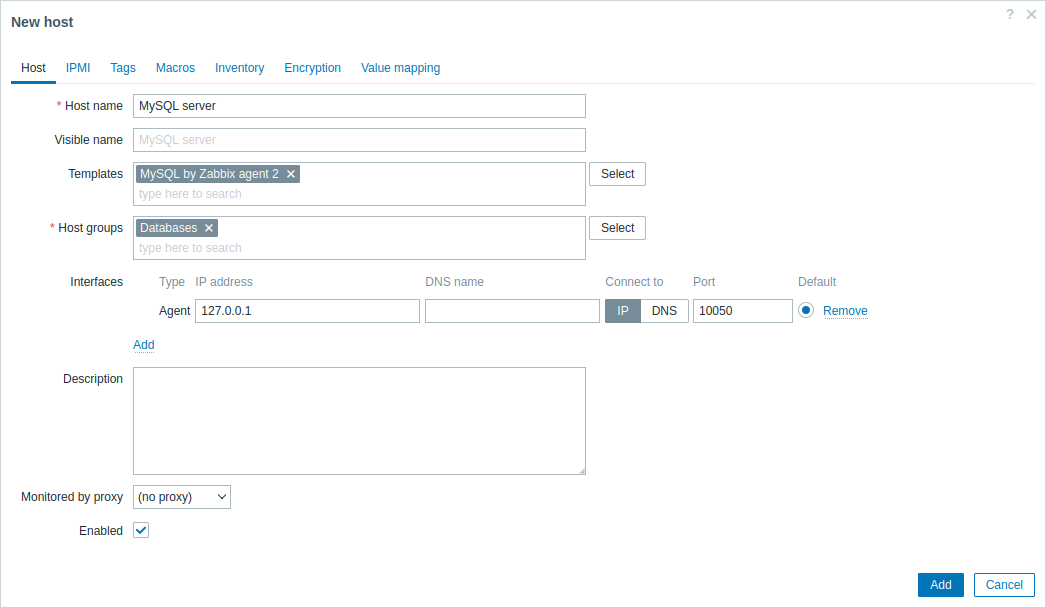
2. Crea un host nell'interfaccia web di Zabbix:
- Nel campo Host name, inserisci un nome host (ad esempio, "MySQL server").
- Nel campo Templates, digita o seleziona il template "MySQL by Zabbix agent 2" che verrà collegato all'host.
- Nel campo Host groups, digita o seleziona un gruppo host (ad esempio, "Databases").
- Nel campo Interfaces, aggiungi un'interfaccia di tipo "Agent" e specifica l'indirizzo IP del tuo server MySQL. Questa guida usa "127.0.0.1" (localhost) per monitorare un server MySQL installato sulla stessa macchina di Zabbix server e Zabbix agent 2.
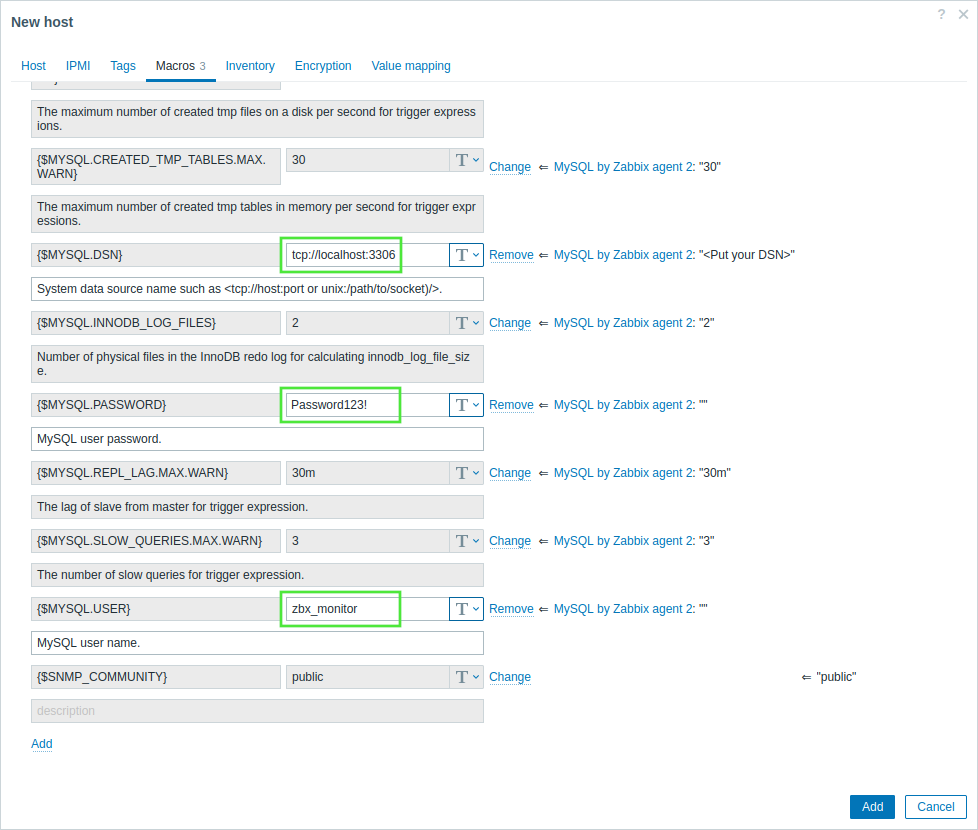
- Nella scheda Macros, passa a Inherited and host macros, cerca le seguenti macro e fai clic su Change accanto al valore della macro per aggiornarlo:
- {$MYSQL.DSN} - imposta l'origine dati del server MySQL (la stringa di connessione di una sessione denominata dal file di configurazione del plugin MySQL di Zabbix agent 2). Questa guida usa l'origine dati predefinita "tcp://localhost:3306" per monitorare un server MySQL installato sulla stessa macchina di Zabbix server e Zabbix agent 2.
- {$MYSQL.PASSWORD} - imposta la password del precedente utente MySQL creato "zbx_monitor".
- {$MYSQL.USER} - imposta il nome del precedente utente MySQL creato "zbx_monitor".
3. Fai clic su Add per aggiungere l'host. Questo host rappresenterà il tuo server MySQL.
Visualizzare le metriche raccolte
Congratulazioni! A questo punto, Zabbix sta già monitorando il tuo server MySQL.
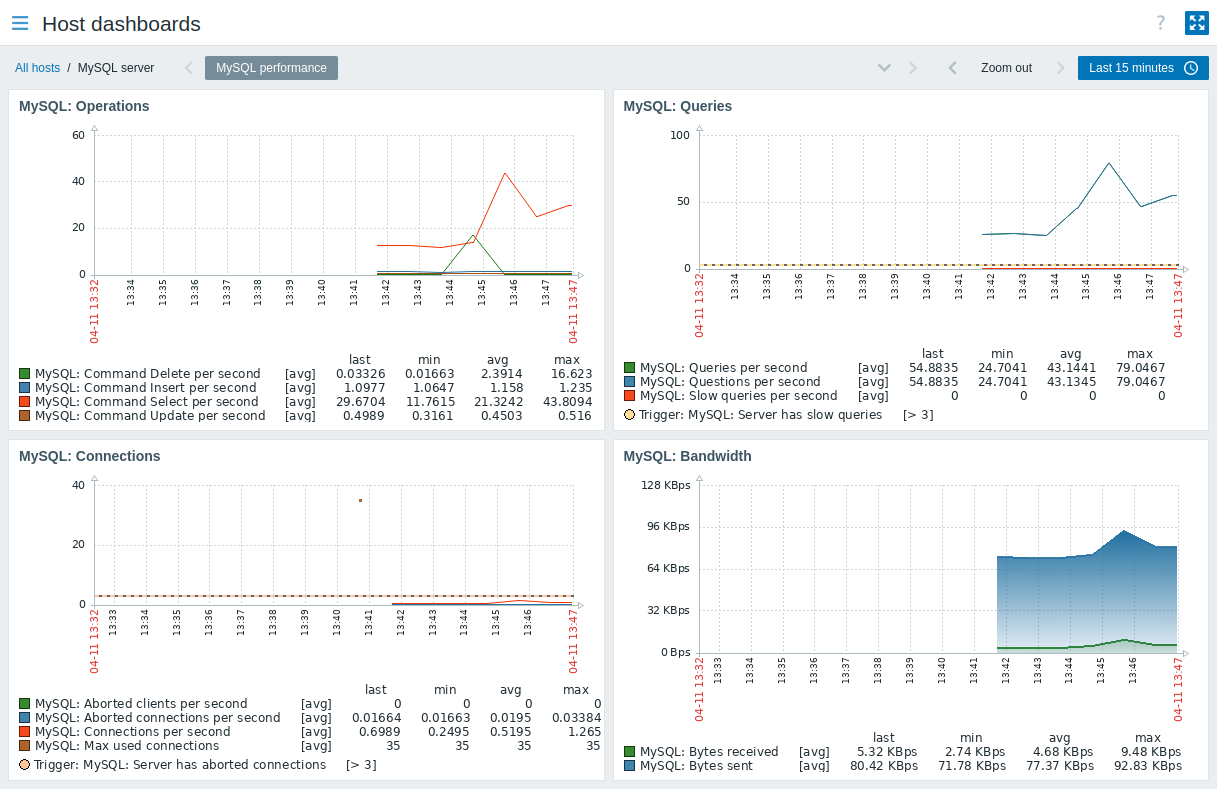
Per visualizzare le metriche raccolte, vai alla sezione di menu Monitoring → Hosts e fai clic su Dashboards accanto all'host.
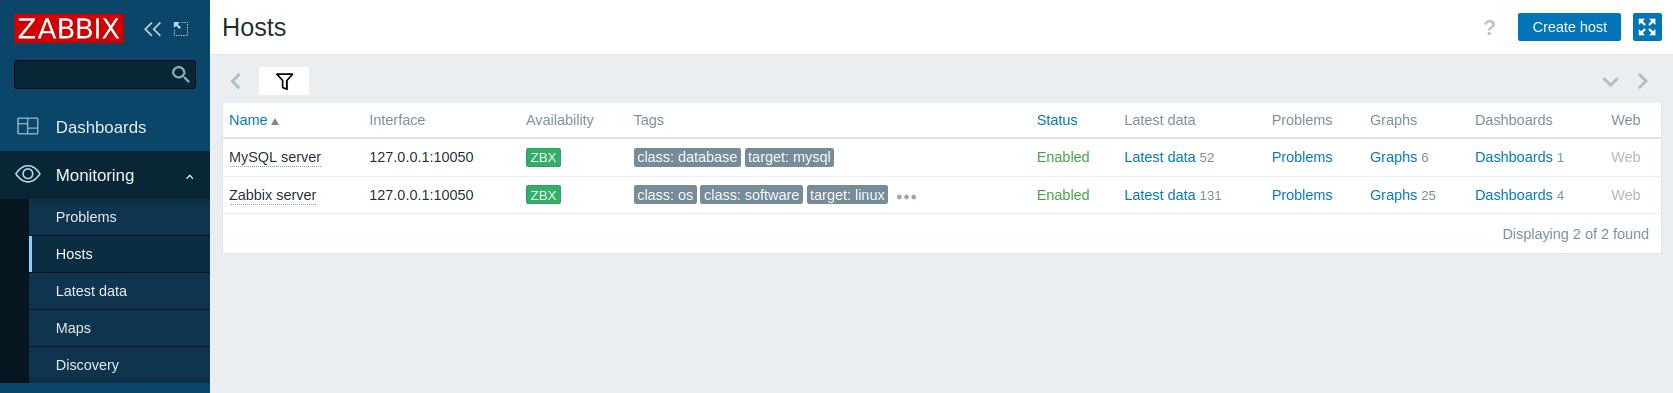
Questa azione ti porterà alla dashboard dell'host (configurata a livello di template) con le metriche più importanti raccolte dal server MySQL.
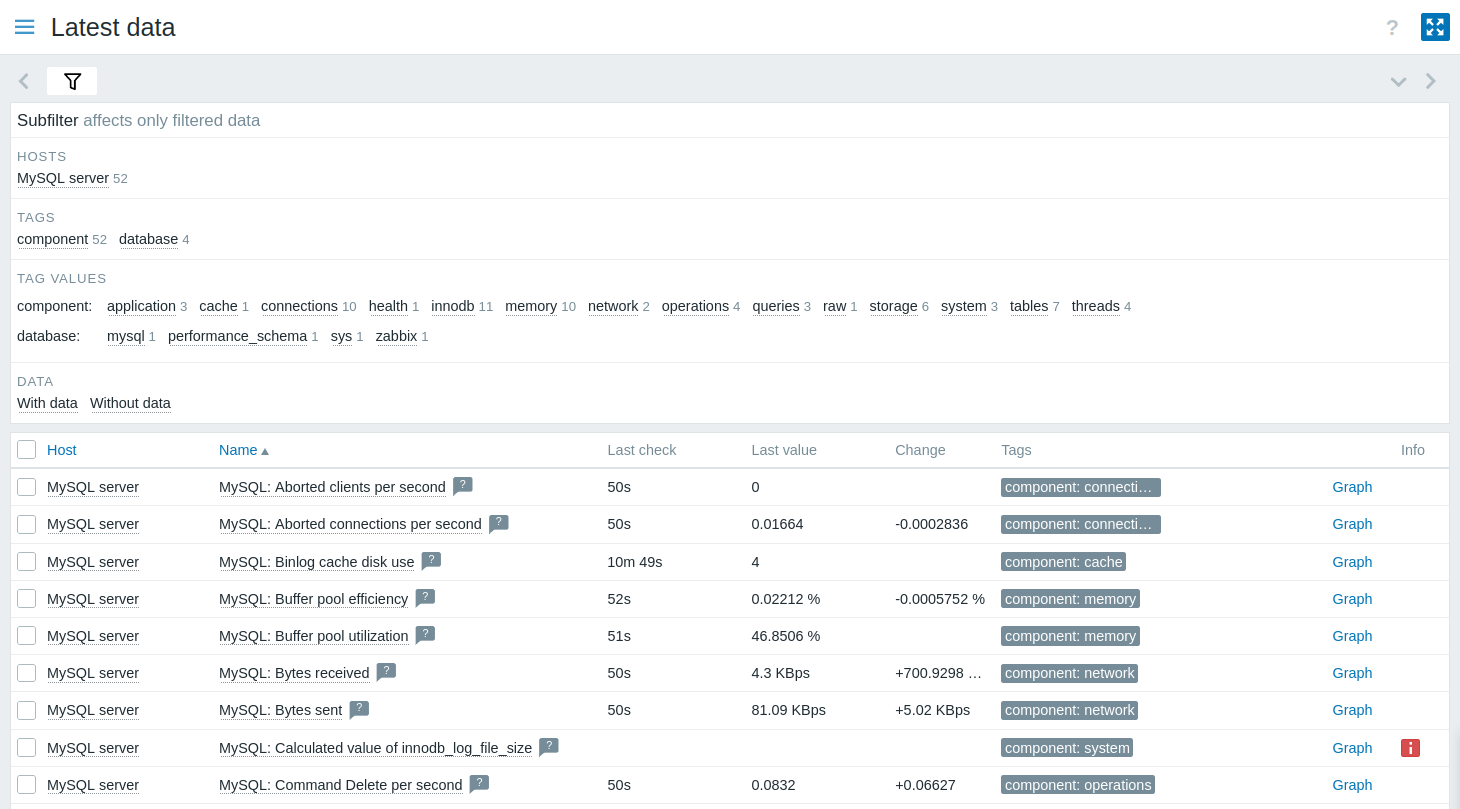
In alternativa, dalla sezione di menu Monitoring → Hosts, puoi fare clic su Latest data per visualizzare in un elenco tutte le metriche raccolte più recenti. Nota che l'item MySQL: Calculated value of innodb_log_file_size è previsto che non abbia dati, poiché il valore verrà calcolato dai dati dell'ultima ora.
Configurare gli avvisi di problema
Zabbix può notificarti un problema nella tua infrastruttura usando diversi metodi. Questa guida fornisce i passaggi di configurazione di base per inviare avvisi via email.
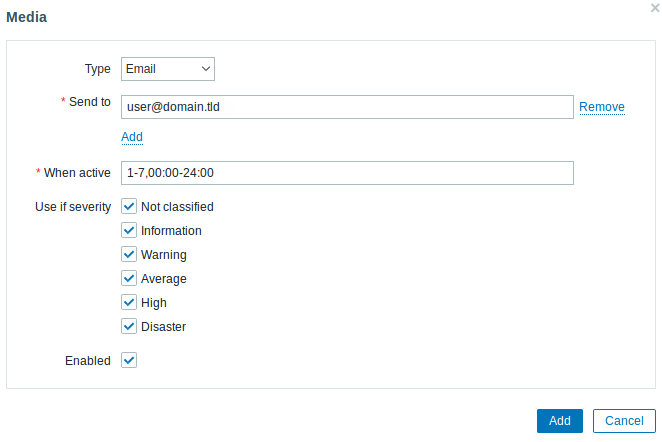
1. Vai a Impostazioni utente → Profilo, passa alla scheda Media e aggiungi la tua email.
2. Segui la guida per Ricevere una notifica di problema.
La prossima volta che Zabbix rileverà un problema, dovresti ricevere un avviso via email.
Testare la configurazione
Per testare la configurazione, possiamo simulare un problema reale aggiornando la configurazione dell'host nel frontend di Zabbix.
1. Apri la configurazione dell'host del tuo server MySQL in Zabbix.
2. Passa alla scheda Macros e seleziona Inherited and host macros.
3. Fai clic su Change accanto, ad esempio, al valore della macro {$MYSQL.USER} configurato in precedenza e imposta un nome utente MySQL diverso.
4. Fai clic su Update per aggiornare la configurazione dell'host.
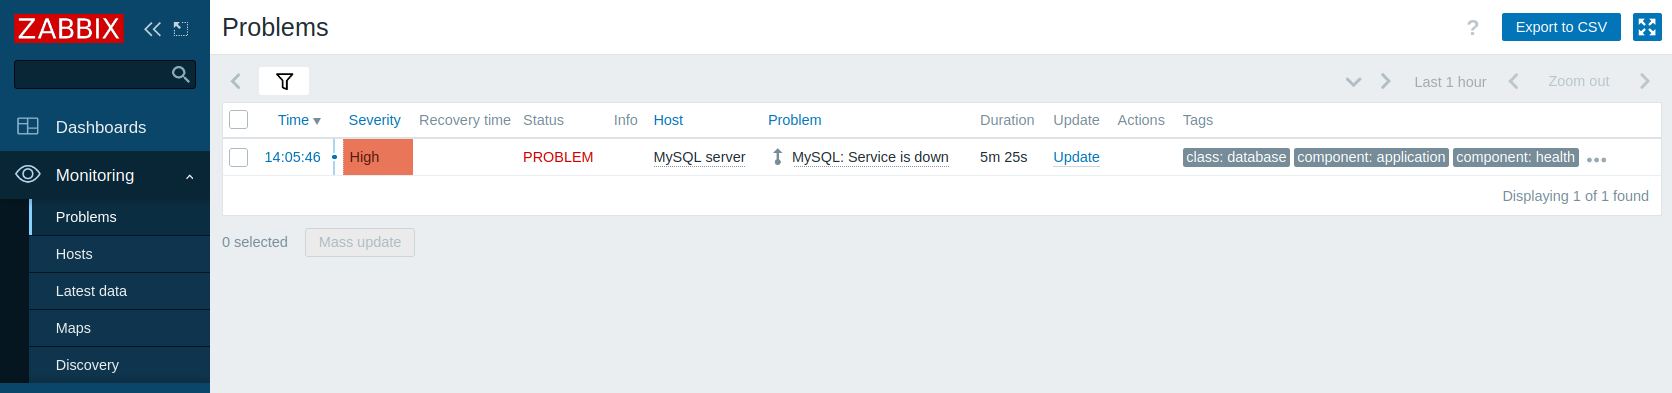
5. Tra qualche istante, Zabbix rileverà il problema "MySQL: Service is down", perché non sarà in grado di connettersi al server MySQL. Il problema apparirà in Monitoring → Problems.
Se gli avvisi sono configurati, riceverai anche la notifica del problema.
6. Riporta il valore della macro al valore precedente per risolvere il problema e continuare a monitorare il server MySQL.
Altri approcci per monitorare MySQL
Invece di monitorare un server MySQL con Zabbix agent 2, è possibile utilizzare anche Zabbix agent o lo standard Open Database Connectivity (ODBC). Sebbene sia consigliato l'uso di Zabbix agent 2, potrebbero esserci alcune configurazioni che non lo supportano o che richiedono un approccio personalizzato.
La differenza principale tra Zabbix agent e ODBC risiede nel metodo di raccolta dei dati: Zabbix agent viene installato direttamente sul server MySQL e raccoglie i dati utilizzando le sue funzionalità integrate, mentre ODBC si basa su un driver ODBC per stabilire una connessione al server MySQL e recuperare i dati tramite query SQL.
Sebbene molti dei passaggi di configurazione siano simili al monitoraggio di un server MySQL con Zabbix agent 2, esistono alcune differenze significative: è necessario configurare Zabbix agent o ODBC per poter monitorare un server MySQL. Le istruzioni seguenti illustrano queste differenze.
Monitorare MySQL con Zabbix agent
Per monitorare un server MySQL con Zabbix agent, è necessario scaricare e installare Zabbix server, Zabbix frontend e Zabbix agent secondo le istruzioni per il proprio sistema operativo.
Una volta installati correttamente i componenti Zabbix richiesti, è necessario creare un utente MySQL come descritto nella sezione Creare un utente MySQL.
Dopo aver creato l'utente MySQL, è necessario configurare Zabbix agent affinché sia in grado di stabilire una connessione con il server MySQL e monitorarlo. Ciò include la configurazione di più parametri utente per eseguire controlli personalizzati dell'agent, nonché la fornitura a Zabbix agent delle credenziali necessarie per connettersi al server MySQL come utente "zbx_monitor" creato in precedenza.
Configurare Zabbix agent
1. Vai alla directory delle configurazioni aggiuntive di Zabbix agent.
cd /usr/local/etc/zabbix/zabbix_agentd.dLa directory delle configurazioni aggiuntive di Zabbix agent dovrebbe trovarsi nella stessa directory del file di configurazione di Zabbix agent (zabbix_agentd.conf).
A seconda del sistema operativo e dell'installazione di Zabbix, questa directory può avere una posizione diversa da quella indicata in questa guida.
Per le posizioni predefinite, controlla il parametro Include nel file di configurazione di Zabbix agent.
Invece di definire nel file di configurazione di Zabbix agent tutti i parametri utente necessari per il monitoraggio del server MySQL, questi parametri verranno definiti in un file separato nella directory delle configurazioni aggiuntive.
2. Crea un file template_db_mysql.conf nella directory delle configurazioni aggiuntive di Zabbix agent.
vi template_db_mysql.conf3. Copia il contenuto del file template_db_mysql.conf (situato nel repository di Zabbix) nel file template_db_mysql.conf che hai creato, quindi salva.
4. Riavvia Zabbix agent per aggiornare la configurazione.
systemctl restart zabbix-agentUna volta configurati i parametri utente di Zabbix agent, puoi passare alla configurazione delle credenziali che consentiranno a Zabbix agent di accedere al server MySQL.
5. Passare alla directory home di Zabbix agent (se non esiste nel sistema, è necessario crearla; predefinita: /var/lib/zabbix).
cd /var/lib/zabbix6. Creare un file .my.cnf nella directory home di Zabbix agent.
vi .my.cnf7. Copiare il seguente contenuto nel file .my.cnf (sostituire <password> con la password dell'utente "zbx_monitor").
[client]
user='zbx_monitor'
password='<password>'
Configura il frontend di Zabbix e testa la tua configurazione
Per configurare il frontend di Zabbix, segui le istruzioni nella sezione Configura il frontend di Zabbix con le seguenti modifiche:
- Nel campo Templates, digita o seleziona il template "MySQL by Zabbix agent" che verrà collegato all'host.
- La configurazione di Macros non è necessaria.
Una volta configurato il frontend di Zabbix, puoi visualizzare le metriche raccolte e configurare gli avvisi sui problemi.
Per testare la tua configurazione, segui le istruzioni nella sezione Testa la tua configurazione con le seguenti modifiche:
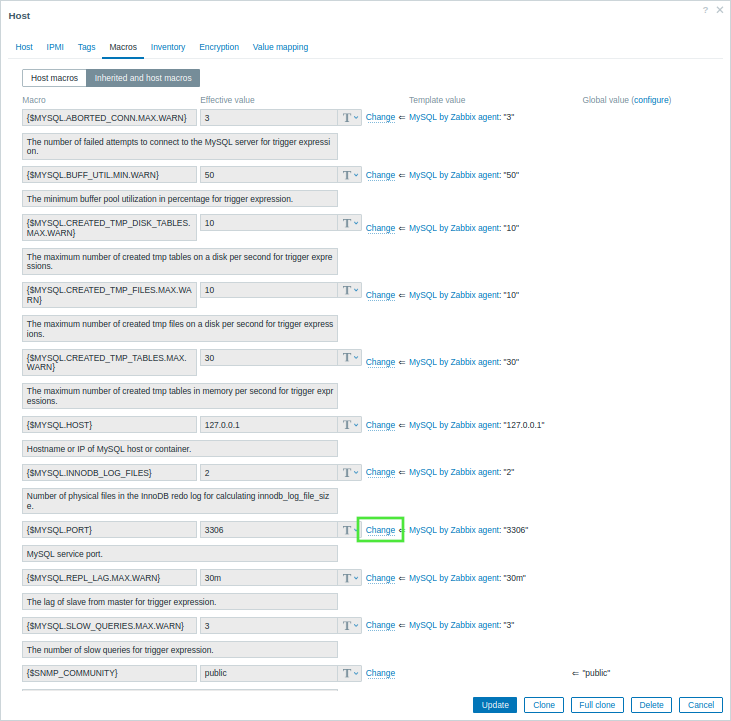
- Nella sezione Inherited and host macros della configurazione dell'host del server MySQL, fai clic su Change accanto al valore della macro {$MYSQL.PORT} e imposta una porta diversa (ad esempio, "6033").
Monitorare MySQL con ODBC
Per monitorare un server MySQL con ODBC, è necessario scaricare e installare Zabbix server e Zabbix frontend.
Una volta installati correttamente i componenti Zabbix richiesti, è necessario creare un utente MySQL come descritto nella sezione Creare un utente MySQL.
Dopo aver creato l'utente MySQL, è necessario configurare ODBC.
Ciò include l'installazione di una delle implementazioni API ODBC open source più comunemente utilizzate - unixODBC - e di un driver unixODBC, nonché la modifica del file di configurazione del driver ODBC.
Configurare ODBC
1. Installare unixODBC. Il modo consigliato per installare unixODBC è utilizzare i repository di pacchetti predefiniti del sistema operativo Linux.
apt install unixodbc2. Installare il driver di database MariaDB unixODBC. Anche se si dispone di un database MySQL, il driver MariaDB unixODBC viene utilizzato per motivi di compatibilità.
apt install odbc-mariadb3. Verificare la posizione dei file di configurazione ODBC odbcinst.ini e odbc.ini.
odbcinst -jIl risultato dell'esecuzione di questo comando dovrebbe essere simile al seguente.
unixODBC 2.3.9
DRIVERS............: /etc/odbcinst.ini
SYSTEM DATA SOURCES: /etc/odbc.ini
FILE DATA SOURCES..: /etc/ODBCDataSources
...
4. Per configurare il driver ODBC per il monitoraggio di un database MySQL, è necessario il nome del driver, che si trova nel file odbcinst.ini. Nell'esempio seguente del file odbcinst.ini, il nome del driver è "MariaDB Unicode".
[MariaDB Unicode]
Driver=libmaodbc.so
Description=MariaDB Connector/ODBC(Unicode)
Threading=0
UsageCount=1
5. Copiare il seguente contenuto nel file odbc.ini (sostituire <password> con la password dell'utente "zbx_monitor"). Questa guida utilizza "127.0.0.1" (localhost) come indirizzo del server MySQL per monitorare un server MySQL installato sulla stessa macchina del driver ODBC. Notare il nome dell'origine dati (DSN) "test", che sarà richiesto quando si configura il frontend Zabbix.
[test]
Driver=MariaDB Unicode
Server=127.0.0.1
User=zbx_monitor
Password=<password>
Port=3306
Database=zabbix
Configurare il frontend di Zabbix e testare la configurazione
Per configurare il frontend di Zabbix, seguire le istruzioni nella sezione Configurare il frontend di Zabbix con le seguenti modifiche:
- Nel campo Templates, digitare o selezionare il template "MySQL by ODBC" che verrà collegato all'host.
- La configurazione di Interfaces non è richiesta.
- Il valore della macro {$MYSQL.DSN} nella sezione Inherited and host macros della configurazione dell'host del server MySQL deve essere impostato sul nome DSN del file odbc.ini.
Una volta configurato il frontend di Zabbix, è possibile visualizzare le metriche raccolte, impostare gli avvisi di problema e testare la configurazione.
Vedi anche
- Creazione di un item - come iniziare a monitorare metriche aggiuntive.
- Escalation dei problemi - come creare scenari di avviso multi-step (ad esempio, inviare prima un messaggio all'amministratore di sistema e poi, se un problema non viene risolto entro 45 minuti, inviare un messaggio al responsabile del data center).
- Monitoraggio ODBC - come configurare ODBC su altre distribuzioni Linux e come iniziare a monitorare metriche aggiuntive relative al database con ODBC.
- Template MySQL by Zabbix agent - informazioni aggiuntive sul template MySQL by Zabbix agent.
- Template MySQL by Zabbix agent 2 - informazioni aggiuntive sul template MySQL by Zabbix agent 2.
- Template MySQL by ODBC - informazioni aggiuntive sul template MySQL by ODBC.