
5 What's new in Zabbix 7.4.0
See breaking changes for this version.
Nested low-level discovery
It is now possible to create multi-level discovery of objects with the introduction of discovery prototypes within a low-level discovery rule. For example, you may want to discover all database instances on a database server, then discover tablespaces for each instance, then discover tables for each tablespace.
Discovery prototypes are nested discovery rules within a "parent" discovery rule. Discovery prototypes have their own item, trigger, graph, host, and discovery prototypes.
A nested discovery prototype may use the same JSON value as the parent rule, but then use a different "slice" of data from the JSON value.
The levels of nesting for discovery prototypes are unlimited.
Host prototypes on discovered hosts
Host prototypes are now supported on discovered hosts, enabling Zabbix to automatically discover and monitor entities within other discovered entities (e.g., hypervisors, their virtual machines, and containers inside those virtual machines).
You can create host prototypes on discovered hosts by creating low-level discovery rules with host prototypes or by linking a template with host prototypes. Alternatively, you can link a template to the host prototype used for discovery, which will cause discovered hosts to inherit the host prototypes from the template.
If your current configuration includes host prototypes that use templates containing other host prototypes, please see Upgrade notes.
OAuth 2.0 authentication
OAuth 2.0 authentication is now supported for the SMTP protocol. To configure OAuth authentication, select "OAuth" in the Authentication parameter when configuring an email media type and then specify parameters for the OAuth token retrieval.
The retrieval of OAuth tokens has automated features for Gmail, Gmail relay and Office365 email providers. It is only required to supply Redirection endpoint, Client ID and Client secret parameter values. Zabbix will automatically fill the other required values (see OAuth URL defaults by provider).
Host Wizard
The new Host Wizard introduces a guided, step-by-step interface for setting up your monitoring target (device, application, service, etc.) in Zabbix. It simplifies the configuration of new or existing hosts by walking users through key steps such as selecting a template, installing Zabbix agent, adding host interfaces, and more.

The Host Wizard can be accessed from Data collection > Hosts or the host menu in various frontend sections.
If you're upgrading from an earlier Zabbix version, templates must be upgraded to work with the Host Wizard. For instructions, see Template upgrade.
Widgets
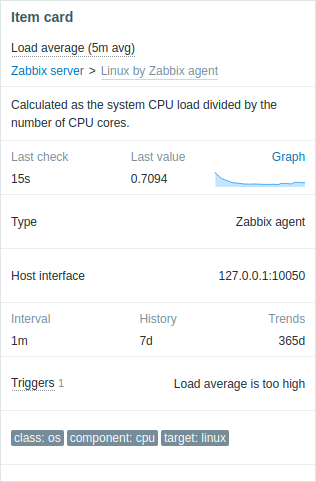
Item card
The Item card widget has been added to dashboard widgets, offering a convenient way to view comprehensive information about a single item at a glance.
Item history
In the Item history widget the scrolling position will now be bottom if new values are configured to be positioned at the bottom. This is useful for reading the latest values of logs.
Real-time widget editing
While editing widgets, you can now preview widget configuration changes in real time. Additionally, widget configuration forms are now draggable, allowing you to reposition them as needed.
Note that the graph preview in the graph widget form has been removed.
Items
ICMP ping item with retry option
A new icmppingretry[<target>,<retries>,<backoff>,<size>,<timeout>,<options>] simple check has been added for host accessibility monitoring by ICMP ping with the ability to modify retries.
Functions
Timestamp tracking
New history functions have been added for timestamp tracking:
firstclock- timestamp of the oldest value within the defined evaluation period;lastclock- timestamp of the Nth most recent value within the defined evaluation period;logtimestamp- log message timestamp of the Nth most recent log item value.
Macros
Item value time tracking
New macros have been added for item-value time tracking:
| Macro | Description |
|---|---|
| {ITEM.LASTVALUE.AGE} | The time that elapsed between the latest item value collection and macro evaluation. |
| {ITEM.LASTVALUE.DATE} | The date when the latest item value was collected. |
| {ITEM.LASTVALUE.TIME} | The time when the latest item value was collected. |
| {ITEM.LASTVALUE.TIMESTAMP} | The timestamp when the latest item value was collected. |
| {ITEM.VALUE.AGE} | The time that elapsed between the item value collection and macro evaluation. |
| {ITEM.VALUE.DATE} | The date when the item value was collected. |
| {ITEM.VALUE.TIME} | The time when the item value was collected. |
| {ITEM.VALUE.TIMESTAMP} | The timestamp when the item value was collected. |
Notifications
Separate menu section for user notifications
For better visibility of user media, user notifications now have their own menu section under User settings.
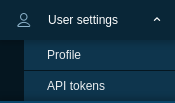
The new Notifications section contains two tabs - Media and Frontend notifications, which previously were part of the user profile section.
Managing own user media
All users are now allowed to manage their own media by default.
However, user permissions to change media details for themselves can be granted/revoked based on their user role (see Create and edit own media option).
Additionally, Super admin user permissions to change media details for others can also be granted/revoked based on their user role (see Create and edit user media option).
Maps
Auto-hide labels
It is now possible to configure map element/link labels to be displayed only when they are hovered on or selected. This setting helps to reduce visual clutter in maps with many elements close to each other.
Auto-hiding of labels can be configured for all map elements/links globally or for an individual map element/link.
Proportional scaling of background images
It is now possible to proportionally scale background images to fit the map size.
Element ordering
It is now possible to bring one element in front of the other (or vice versa) by clicking on the element with the right mouse button and selecting Bring forward/Bring to front or Send backward/Send to back options.

Additionally, if map elements contain both a link between them and a highlight, the link will now appear below the highlight.
Link indicators based on item value
In the previous versions it was possible to adjust link style and color if some trigger went into a problem state. Now similar functionality is available based on item values.
It is possible to have link style and color adjusted if an item value:
- reaches a defined threshold (for numeric items);
- matches a regular expression (for text items).

Processes
Managing history cache
In some data collection scenarios, specific items can temporarily block the server/proxy history cache. This may delay writing history data to the database and slow down the system. To help manage the history cache, the following improvements have been introduced:
- Manual cache clearing: The new history_cache_clear=target runtime command for Zabbix server/proxy allows you to manually clear the history cache for a specific item by its ID.
- Automatic cache clearing: When you disable an item, it is immediately removed from the history cache (except for its last value, which is kept for logs). Similarly, when you disable a host, all its items are removed from the history cache (except for their last values).
- Cache diagnostics logging: When the history cache is full, Zabbix server/proxy now logs history cache diagnostic information starting from DebugLevel=3 (previously DebugLevel=4). The log contains items with the most values in the history cache.
For long-term system stability, make sure that data collection is balanced with available resources (database performance, cache size, collection intervals, log item parameters, etc.). You can monitor Zabbix history cache using the zabbix[wcache] internal item. You can also consider increasing the size of the history cache for Zabbix server/proxy.
History syncer transaction statistics
The history syncer process title now displays detailed statistics about history syncer transactions for Zabbix server and proxy.
Security
TLS encryption between frontend and server
It is now possible to encrypt communication between Zabbix frontend and Zabbix server using TLS. This feature is controlled by new parameters in the server configuration (TLSListen, TLSFrontendAccept, TLSFrontendCertIssuer, TLSFrontendCertSubject, FrontendAllowedIP).
Resolving secret vault macros by server/proxy independently
It is now possible to configure that vault secret macro values are retrieved by Zabbix server and Zabbix proxy independently if Resolve secret vault macros by is set to "Zabbix server and proxy".
Plugins
Custom query path configuration for loadable plugins
The Plugins.*.CustomQueriesPath parameter in Zabbix agent 2 plugin configuration files for MySQL, Oracle, and PostgreSQL, as well as Plugins.MSSQL.CustomQueriesDir for MSSQL, now has a default value. This functionality is disabled by default and can be enabled using the newly introduced Plugins.*.CustomQueriesEnabled parameter.
Frontend
Inline validation in forms
The following frontend forms now support inline validation, showing any input errors immediately after you fill in the fields:
- Template configuration
- Host configuration
- Item and item prototype configuration
- Trigger and trigger prototype configuration
- Module administration
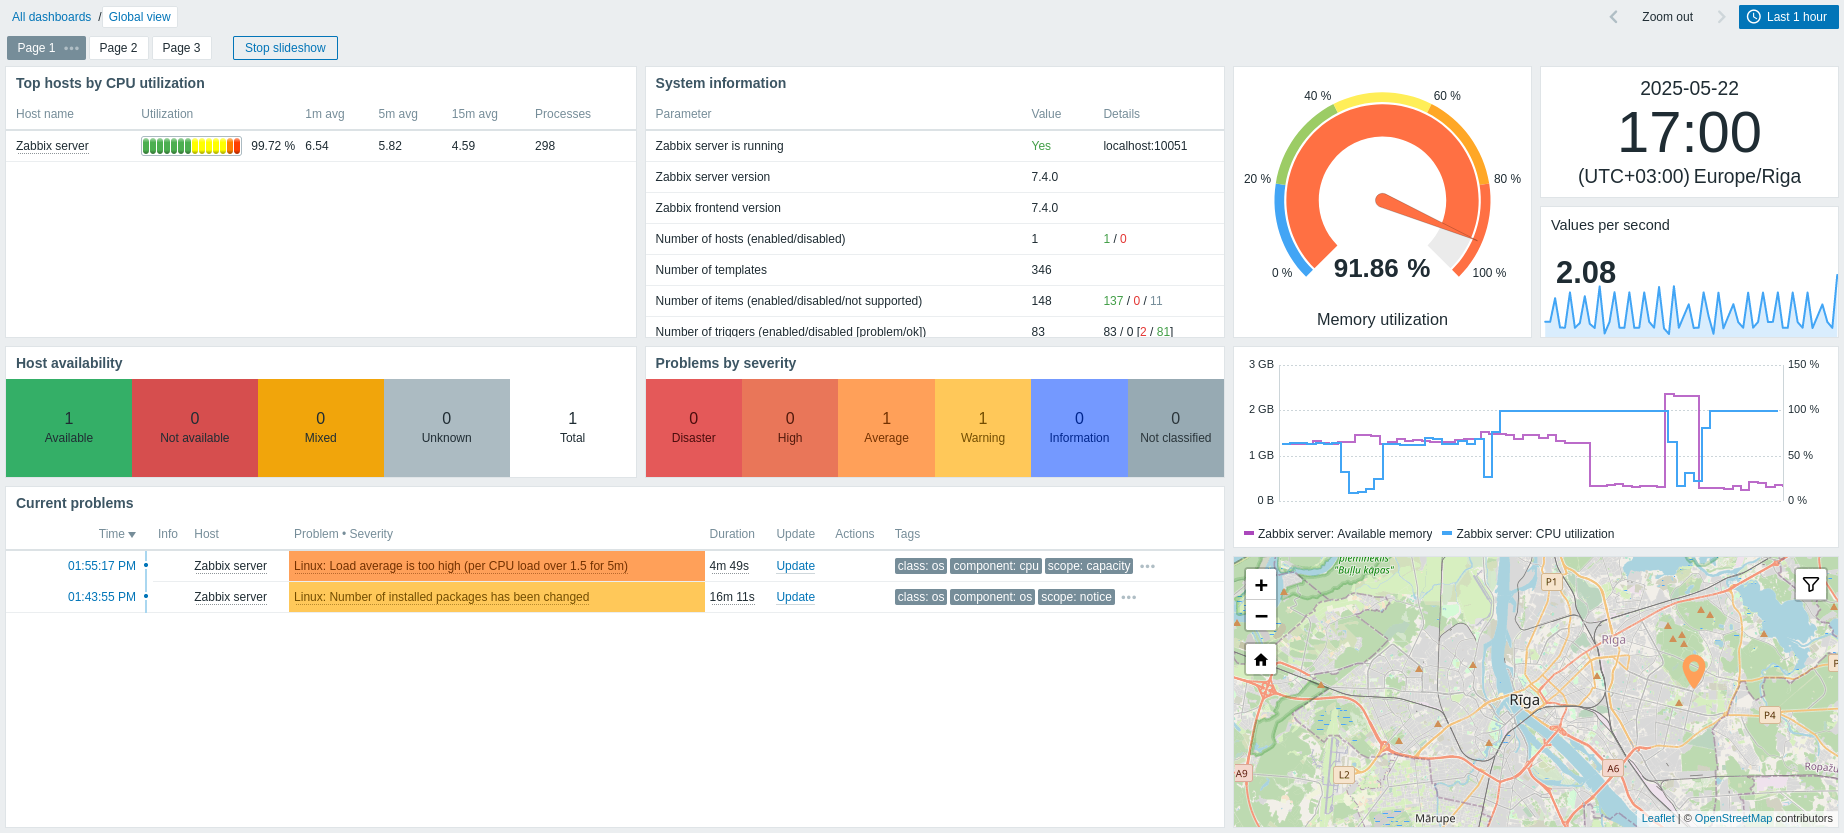
Default dashboard updated
The Global view default dashboard in new Zabbix installations has been updated to include the latest dashboard widgets.
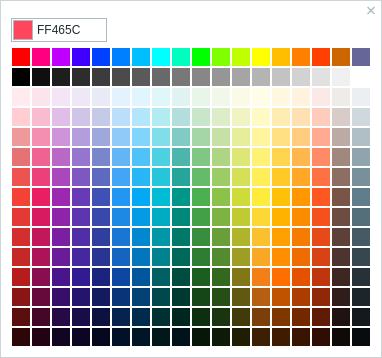
Enhanced color picker with palette support
The color picker in graph and pie chart widgets has been redesigned for improved usability. In addition to solid colors and hex input, you can now switch to a Palette tab and pick from predefined color rows—each series gets its own distinct hue for clearer differentiation. The picker also offers full keyboard navigation and live validation.
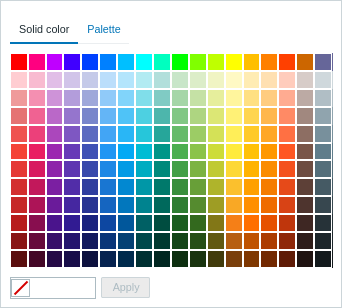 |
In Zabbix 7.4 (Solid color tab) |
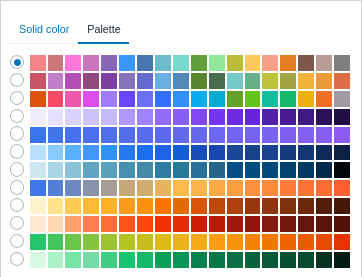 |
In Zabbix 7.4 (Color palette tab) |
 |
Before Zabbix 7.4 |
Modal forms
Several frontend forms are now opened in modal (pop-up) windows:
- Graph configuration
- Graph prototype configuration
Easier copying for preprocessing test results
It is now easier to copy values in preprocessing test results using the added Copy to clipboard button.

Note that a similar button now replaces the Copy link for created API tokens.
Documentation
Consolidated documentation pages for minor releases
Release documentation for minor versions of a major Zabbix release will now be collected in single documentation pages for new features and upgrade notes respectively.