
7 Audit
Overview
In the Administration → Audit section users can view records of changes made in the frontend and details of executed actions.
By default frontend audit records are displayed. To switch to action details and back, use the dropdown in the top right-hand corner.
Logs
In this screen audit logs of various changes made in the frontend can be seen. You can use the filter, located below the Logs bar, to narrow down the records by user, activity type, affected resource and the time period.
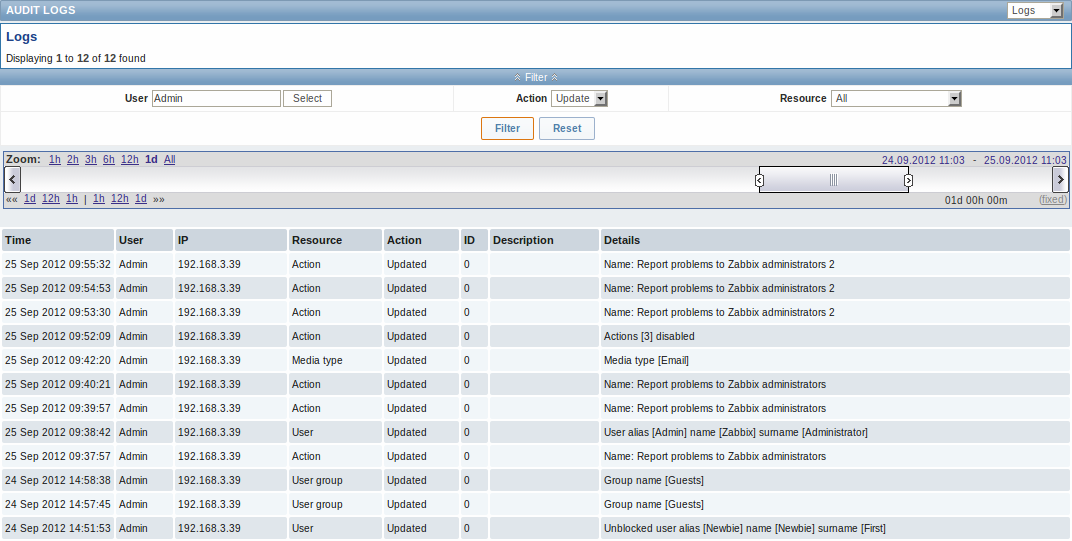
Displayed data:
| Column | Description |
|---|---|
| Time | Timestamp of the audit record. |
| User | User of the activity. |
| IP | IP that was used in the activity. |
| Resource | Affected resource is displayed. |
| Action | Activity type is displayed - Login, Logout, Added, Updated, Deleted, Enabled or Disabled. |
| ID | ID of the affected resource is displayed. |
| Description | Description of the resource is displayed. |
| Details | Detailed information on the performed activity is displayed. |
Actions
In this screen details of executed actions (notifications or remote commands) are displayed.
You can use the filter, located below the Actions bar, to narrow down the records by recipient of e-mail and time period.
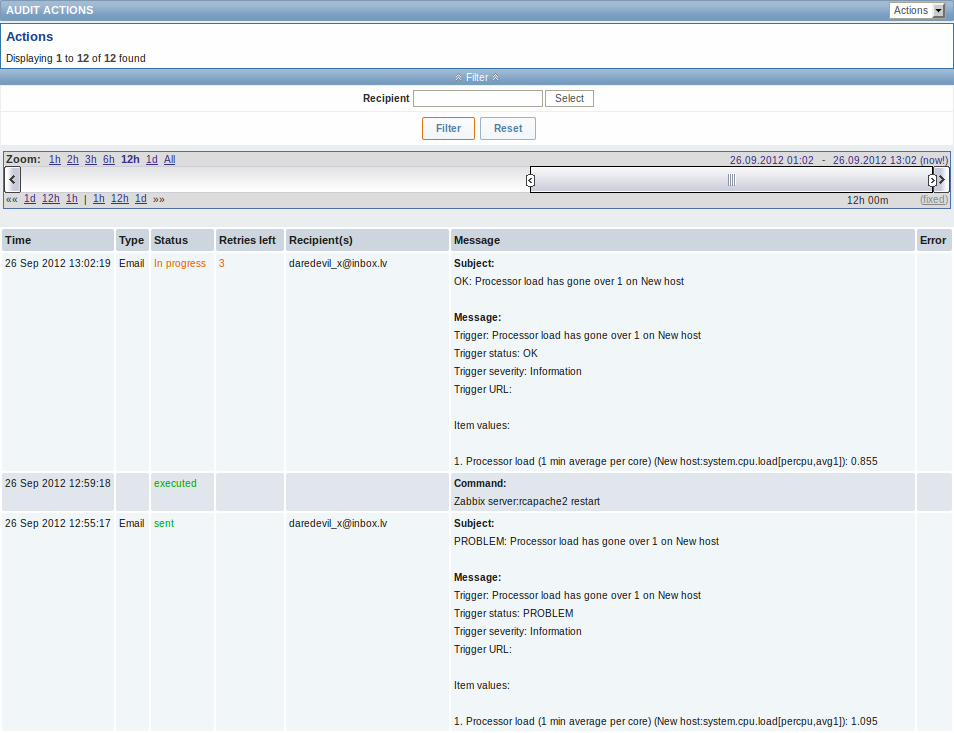
Displayed data:
| Column | Description |
|---|---|
| Time | Timestamp of the action. |
| Type | Action type is displayed - Email or Command. |
| Status | Action status is displayed: in progress - action is in progress sent - notification has been sent executed - command has been executed not sent - action has not been completed |
| Retries left | The remaining number of times the server will try to send the notification is displayed. |
| Recipient(s) | Notification recipient(s) e-mail addresses are displayed. |
| Message | The content of the message/remote command is displayed. |
| Error | Error information regarding the action execution is displayed. |