
1 Proxies
Overview
A Zabbix proxy can collect performance and availability data on behalf of the Zabbix server. This way, a proxy can take on itself some of the load of collecting data and offload the Zabbix server.
Also, using a proxy is the easiest way of implementing centralized and distributed monitoring, when all agents and proxies report to one Zabbix server and all data is collected centrally.
A Zabbix proxy can be used to:
- Monitor remote locations
- Monitor locations having unreliable communications
- Offload the Zabbix server when monitoring thousands of devices
- Simplify the maintenance of distributed monitoring
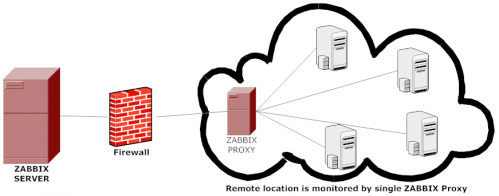
The proxy requires only one TCP connection to the Zabbix server. This way it is easier to get around a firewall as you only need to configure one firewall rule.
Zabbix proxy must use a separate database. Pointing it to the Zabbix server database will break the configuration.
All data collected by the proxy is stored locally before transmitting it over to the server. This way no data is lost due to any temporary communication problems with the server. The ProxyLocalBuffer and ProxyOfflineBuffer parameters in the proxy configuration file control for how long the data are kept locally.
It may happen that a proxy, which receives the latest configuration changes directly from Zabbix server database, has a more up-to-date configuration than Zabbix server whose configuration may not be updated as fast due to the value of CacheUpdateFrequency. As a result, proxy may start gathering data and send them to Zabbix server that ignores these data.
Zabbix proxy is a data collector. It does not calculate triggers, process events or send alerts. For an overview of what proxy functionality is, review the following table:
| Function | Supported by proxy | |
|---|---|---|
| Items | ||
| Zabbix agent checks | Yes | |
| Zabbix agent checks (active) | Yes 1 | |
| Simple checks | Yes | |
| Trapper items | Yes | |
| SNMP checks | Yes | |
| SNMP traps | Yes | |
| IPMI checks | Yes | |
| JMX checks | Yes | |
| Log file monitoring | Yes | |
| Internal checks | No | |
| SSH checks | Yes | |
| Telnet checks | Yes | |
| External checks | Yes | |
| Built-in web monitoring | Yes | |
| Network discovery | Yes | |
| Low-level discovery | Yes | |
| Calculating triggers | No | |
| Processing events | No | |
| Sending alerts | No | |
| Remote commands | No | |
[1] To make sure that an agent asks the proxy (and not the server) for active checks, the proxy must be listed in the ServerActive parameter in the agent configuration file.
Configuration
Once you have installed and configured a proxy, it is time to configure it in the Zabbix frontend.
Adding proxies
To configure a proxy in Zabbix front end:
- Go to: Administration → DM
- Click on Create proxy
| Parameter | Description |
|---|---|
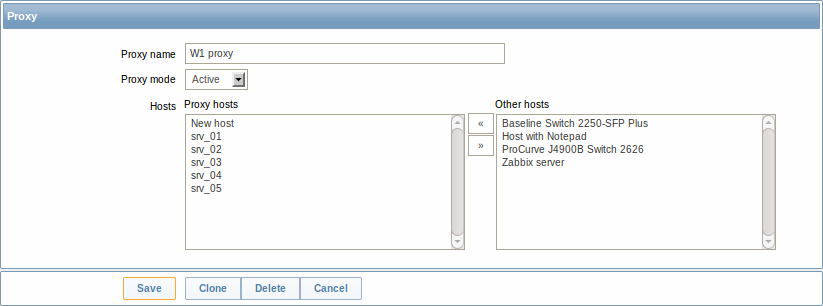
| Proxy name | Enter the proxy name. It must be the same name as in the Hostname parameter in the proxy configuration file. |
| Proxy mode | Select the proxy mode. Active - the proxy will connect to the Zabbix server and request configuration data Passive - Zabbix server connects to the proxy |
| Hosts | Add hosts to be monitored by the proxy. |
Host configuration
You can specify that an individual host should be monitored by a proxy in the host configuration form, using the Monitored by proxy field.
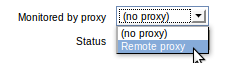
Host mass update is another way of specifying that hosts should be monitored by a proxy.