
Table of Contents
- 5 What's new in Zabbix 2.0.0
- 5.1 Major new features
- 5.2 Frontend improvements
- 5.2.1 A new look
- 5.2.2 Reworked frontend
- 5.2.3 Dropping IE6 support
- 5.2.4 SQLite supported by frontend
- 5.2.5 Improved frontend performance
- 5.2.6 New network map icons
- 5.2.7 More intuitive range selecting
- 5.2.8 Customisable dashboard
- 5.2.9 Translations managed by gettext
- 5.2.10 Network map improvements
- 5.2.11 Customisable trigger severity names and colours
- 5.2.12 Customisable problem displaying
- 5.2.13 Inventory report
- 5.2.14 Event export to CSV
- 5.2.15 User executable script improvements
- 5.2.16 Media type improvements
- 5.2.17 Improved popup placement
- 5.2.18 Improved IT services view and configuration
- 5.2.19 Templated host screens
- 5.2.20 Ability to sort triggers in screens
- 5.2.21 Warning when a too large file is attempted to be uploaded
- 5.2.22 Improved configuration wizard
- 5.2.23 Trigger config helper
- 5.2.24 Improved search results page
- 5.2.25 Host popup menu added to more pages
- 5.2.26 New option "Expand macros" for maps configuration screen
- 5.2.27 Improved debug layout
- 5.2.28 Allow deleting trigger dependencies during mass update
- 5.2.29 New and updated translations
- 5.3 New and improved items
- 5.4 Daemon performance improvements
- 5.5 Other improvements
- 5.5.1 Nanosecond support
- 5.5.2 Database integrity
- 5.5.3 Improved active agent auto-registration
- 5.5.4 Automatic filling of DNS names
- 5.5.5 Event redesign
- 5.5.6 Supported macro changes
- 5.5.7 Boolean item type
- 5.5.8 API access changes
- 5.5.9 Unified time format
- 5.5.10 "Host profiles" renamed to "host inventory" and merged
- 5.5.11 Escalations enabled by default
- 5.5.12 Remote command improvements
- 5.5.13 Changed default locations
- 5.5.14 Configuration files and directories added during installation
- 5.5.15 Unsupported item information sent by proxies
- 5.5.16 Simplified ServerActive logic
- 5.5.17 Simplified Zabbix agent daemon configuration
- 5.5.18 Monitoring of files larger than 2GB
- See also
5 What's new in Zabbix 2.0.0
5.1 Major new features
5.1.1 Low level discovery
Low level discovery documentation
5.1.1.1 Network interface discovery
Network interface discovery support has been added for the following platforms:
- Linux
- Windows
- Solaris
- HP-UX
- AIX
5.1.1.2 Mounted filesystem discovery
Mounted filesystem discovery returns filesystem names along with their types.
Network interface discovery support has been added for the following platforms:
- Linux
- Windows
- Solaris
- HP-UX
- AIX
- FreeBSD
- OpenBSD
- NetBSD
- MacOS X
It is possible to filter by regular expression on the filesystem name or type.
5.1.2 Automatic inventory data collection
Host inventory now can be populated automatically. Items have a property that allows to store their value in any of the inventory fields if inventory is set to Automatic mode.
5.1.3 WEB monitoring by Zabbix proxies
WEB scenarios could be monitored by remote proxies. It allows monitoring of WEB applications from various geographical locations.
Also new items "Last error message of scenario '$1'" with key web.test.error[<a scenario name>] will be added to all existing scenarios during database upgrade.
5.1.4 Multi-homed host support
Zabbix now supports multiple interfaces per host. You can configure several interface-host pairs in the host properties, and specify which should be used as the default for several item types (Zabbix agent, SNMP and IPMI). Additionally, you can override interface on the item level. When a template is linked to a host that has multiple interfaces defined, default interface for that type used (which currently is the first interface in the list). A single item can only be monitored on a single interface.
Interfaces that are used in any items can not be removed and link Remove is greyed out for them.
Together with the ability to use user macros in any of the port fields this should provide a flexible and powerful way to monitor multi-homed hosts.
For SNMP items, port on the item level, if specified, overrides the interface port.
Interface for an item can be selected in item properties. Both in item properties and item mass update form interfaces are grouped by their type.
5.1.5 Direct JMX monitoring support
Ability to monitor JMX without deploying additional software has been introduced in the form of a Java gateway.
5.1.6 Visible host name
Visible host name has been implemented; UTF8 support; new macros ({HOST.HOST}, {HOST.NAME}, {HOST.IP}); {IPADDRESS}, {HOSTNAME} deprecated
5.1.7 SNMP trap monitoring
5.2 Frontend improvements
5.2.1 A new look
Zabbix frontend has received a redesign. The login page, table view, configuration wizard, default trigger severity colours all have a fresh new look.
5.2.2 Reworked frontend
The frontend has been changed to be more user friendly, especially on smaller screens. Many pages that previously required horizontal scrolling now fit in the screen thanks to improved layout and tabbed interface.
The following pages have been redone:
- Host and template properties
- Host properties now also include host navigation interface, making it easy to jump from host properties to editing items, triggers, graphs or other entities for that host (screenshots to compare 1.8 vs 2.0)
- Proxy properties
- Item properties
- Trigger properties
- Action properties
- Graph properties
- Graph item reordering now isn't done by repeated clicks on Up and Down links. Instead, drag'n'drop reordering is possible.
5.2.3 Dropping IE6 support
Support for Microsoft Internet Explorer 6 will not be provided anymore. While we were at that, we also dropped IE7 support.
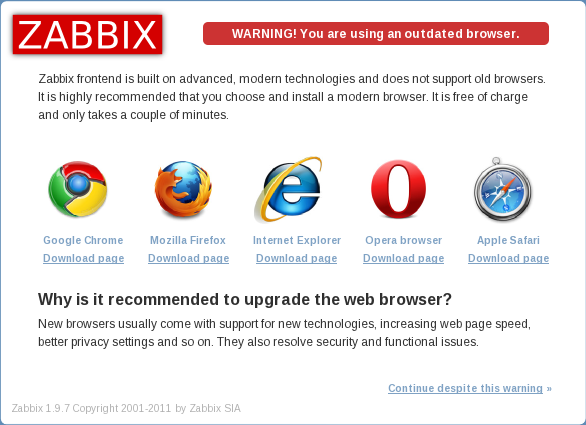
5.2.3.1 Outdated browser warning
If an outdated browser will be detected by Zabbix frontend, a warning page will be displayed. It will link to download pages for multiple more recent browsers. User would not be blocked from accessing Zabbix frontend, though - that would still be possible via the link in the lower right corner.
5.2.4 SQLite supported by frontend
5.2.5 Improved frontend performance
Multiple sections of frontend have their performance improved, including:
- Dashboard performance has been improved for systems with lots of events.
- Network maps for non-superusers
- Screens for non-superusers
- IT services monitoring and configuration sections
- Availability report
5.2.6 New network map icons
For Zabbix 2.0, a completely new set of network icons is provided, and several new icons have been introduced.
<list of icons>
5.2.7 More intuitive range selecting
Previously, selecting a range of entities in Zabbix frontend was not very intuitive - one had to hold down Ctrl both for the range start and range end. Starting with 2.0, range selection works as in most other software. One just clicks on a checkbox that should start range selection, then, holding down shift, clicks on the checkbox that should be the end for the range. It works the same way for selecting and unselecting (taking the choice from the very first click).
5.2.8 Customisable dashboard
Dashboard elements can now be arranged in a custom layout by dragging and dropping them in the desired location. They can be placed in up to 3 columns.
5.2.9 Translations managed by gettext
Frontend translations are now managed by gettext. This means that standard tools like Pootle, Poedit or Virtaal can be used to translate Zabbix frontend. That should also allow working on smaller sections of the translation and improve collaboration possibilities.
5.2.10 Network map improvements
Network maps have received a couple of improvements regarding URL handling.
** Multiple URLs for map elements **
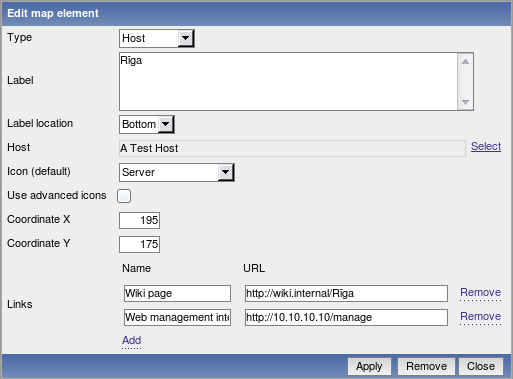
In previous Zabbix versions, it was possible to add single URL for each network map element. Now it is possible to add multiple, while also giving a label for each. This can be done on two levels:
- Map element level
- Map level
For example, here two URLs have been defined on the element (host) level:
On the map level, URLs can be defined for all element types. Here, URL is defined for each available element type:
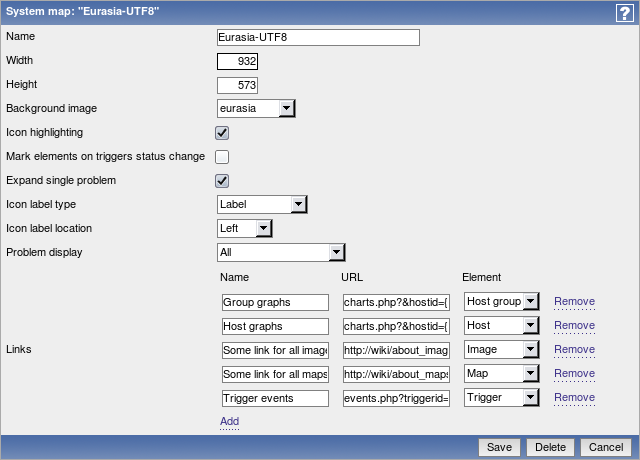
Of course, it is also possible to add multiple URLs for the same element type.
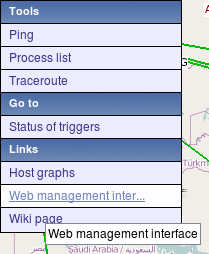
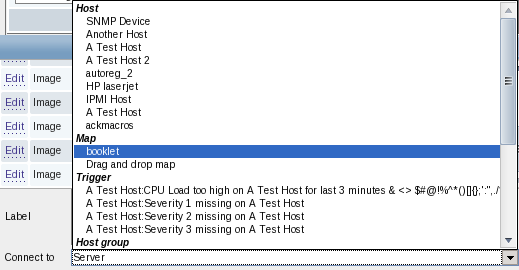
When these URLs have been configured, in the monitoring section clicking on a map element will list them (by name) in the popup menu. If the element has it's own URLs and there are map level URLs for its type defined, they will be combined in the same menu:
From the already existing macros, in map URLs macro {TRIGGER.ID} can be used.
Additionally, 3 new macros have been added that also can be used in element URL fields:
- {HOST.ID}
- {HOSTGROUP.ID}
- {MAP.ID}
** Grid selection saving **
In previous versions, map grid options like whether to display grid or align to it were discarded after the map configuration form was closed. Starting with 2.0.0, selected grid options are saved for each map individually.
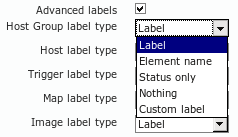
** Setting label type per map element type **
In previous versions, one could select map label type for all map elements in the map. Starting with 2.0.0, it is possible to enable Advanced labels feature per map and choose map element label per element type - image, trigger, host, host group and map.
** Displaying hosts from a host group **
For host group element, it is now possible to specify that it should display all hosts in a group. In that case, area can be specified where hosts will be placed.
** Icon mapping **
Automatic icon selection for host type map elements has been added. It utilises values from host inventory fields to select icon for map elements.
Icon maps are configured in Administration → General → Icon maps. Each icon map has a unique name, default icon and a list of mappings. Each mapping has a match order, expression for matching (PCRE regular expression or Zabbix expression), icon and reference to an inventory field. Icon map can be assigned to a map in the map configuration form, and overridden on map element level.
When deciding on which icon should be used, regular expression will be matched against specified inventory field. Order in which mappings are tried depends on match order.
** Select elements by dragging **
You can now drag a rectangle in map configuration view and select all elements in it.
** Highlighting selected link **
Selected map link now is highlighted in the list of links.
** Changed element highlighting **
Instead of filled rectangle, to indicate selection elements are now highlighted with a thick rectangular border.
** Element properties window changes **
Map element properties window has received multiple modifications.
- Links are only shown when one element is selected
- List of selected elements is displayed above properties themselves (was displayed below before)
- When editing multiple elements, properties that are not marked for updating using the checkbox on the left hand side are not editable
- Only one endpoint of a link may be changed when editing a link. Endpoint that is currently selected can not be changed in this view anymore. Additionally, endpoints are sorted by type in the dropdown
5.2.11 Customisable trigger severity names and colours
Trigger severity names and colours can now be easily customised in Administration → General → Trigger severities.
5.2.12 Customisable problem displaying
The way triggers are displayed in the frontend can now be customised in Administration → General → Trigger displaying options. That includes both OK/PROBLEM and acknowledged/not acknowledged.
Additionally, time for how long OK triggers are shown after changing state and for how long trigger is blinking after changing state can now be configured in the frontend, instead of modifying include/defines.inc.php file.
5.2.13 Inventory report
Ability to report on hosts by their gathered inventory data has been added to Monitoring → Inventory view.
5.2.14 Event export to CSV
Events from Monitoring → Events page can now be exported to a CSV file by using a button in the upper right corner.
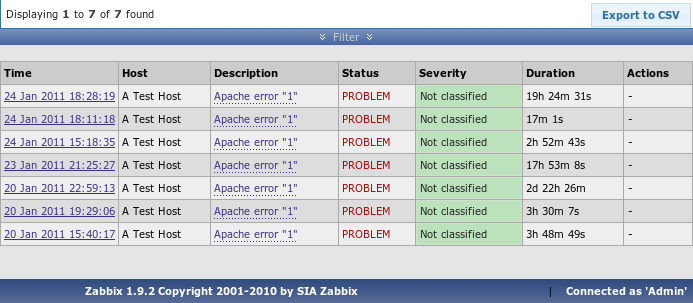
Only currently visible events are exported.
5.2.15 User executable script improvements
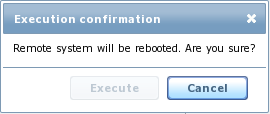
Confirmation for user executable scripts
User scripts that can be configured on the frontend in Administration → Scripts can now display a confirmation message before being executed. A custom message confirmation message can be entered by the administrator. This feature should be especially useful with potentially dangerous operations (like a reboot script) or ones that might take a long time.

Confirmation can be tested in the configuration form. In that case, Execute button is disabled.
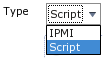
Ability to specify script type
Before, if a user script would have to be an IPMI command, it had to follow a syntax of IPMI <command>. Starting with Zabbix 2.0, it is an option in the script editing form.
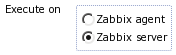
Ability to execute scripts on Zabbix agent
Before Zabbix 2.0, user scripts could be executed on the Zabbix server only. Starting with 2.0, a script can be configured to be executed on the agent instead. For this feature to work, agent must be configured to allow remote commands.
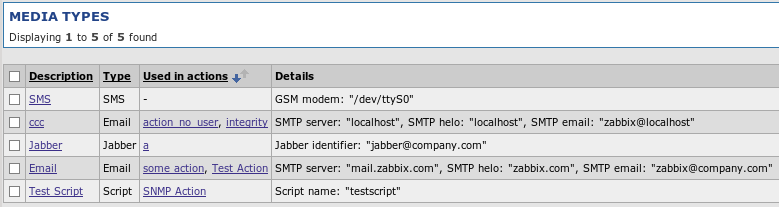
5.2.16 Media type improvements
Displaying of actions that use media types
In media type configuration screen it's now possible to view and access actions that directly refer to this media type (it's selected in the Send only to dropdown). When sorting by that column, entries are only sorted by whether they are referenced, actions referencing media types do not influence the sort order. It is possible to go directly to action configuration from this page as well.
Enabling and disabling media types
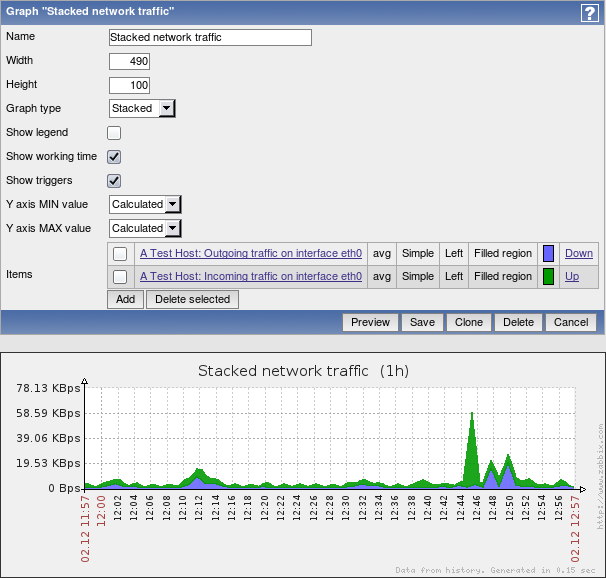
5.2.16.1 Disabling graph legend
For graphs with many items added, legend could grow pretty huge, and there might be other reasons why somebody might want to hide the legend. Starting with Zabbix 2.0.0, that is possible for custom graphs with a simple checkbox:
5.2.17 Improved popup placement
Popups with additional information that appear on mouse roll-over are designed to better fit within smaller screens, such as in mobile devices.
5.2.18 Improved IT services view and configuration
monitoring - shows 80-100% upon mouseover (and a tooltip), reordered sla values, aligned by decimal point, removed graph "show" link (now it's on the bar, link to report is on the service name), expected sla shown in black not green, more...
multiple service dependencies can be selected now
5.2.19 Templated host screens
Screens can be defined in templates. They are available for all hosts that are linked to the template. They can be accessed from the host popup menu everywhere, and from the search results.
5.2.20 Ability to sort triggers in screens
Triggers element (by host or by host group) in screens now can be sorted by severity, host or date.
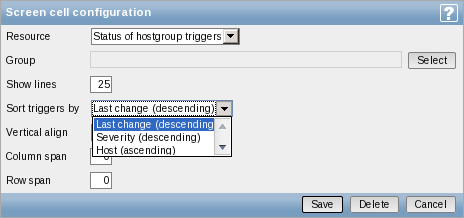
https://support.zabbix.com/browse/ZBXNEXT-746
In the monitoring section, this sorting can only be viewed but not changed. Additionally, in the monitoring section this element shows how many triggers are visible, if not all of them can be shown.
5.2.21 Warning when a too large file is attempted to be uploaded
Previously it was not easy to debug why some upload failed if it exceeded PHP option max_upload_filesize limit. Now Zabbix shows a warning when uploading a too large XML or image file.
5.2.22 Improved configuration wizard
For configuration wizard requirements step, Recommended column was removed, as it did not serve any real purpose. Additionally, for failed PHP configuration requirements exact configuration parameters are now listed in the error messages.
Better text, visuals, removed 2nd and 8th steps
5.2.23 Trigger config helper
Trigger configuration helper does not allow setting parameter in seconds for trigger function last() anymore
5.2.24 Improved search results page
In the search results page, individual blocks have been placed below each other. They can also be collapsed and expanded now.
5.2.25 Host popup menu added to more pages
Host popup menu has been added to the Monitoring → Events, "Event details", and Monitoring → Overview pages. In Monitoring → Overview this menu is available only when hosts are displayed on the left hand side.
5.2.26 New option "Expand macros" for maps configuration screen
In 2.0 macros expanding is turned off by default and new option is introduced for map configuration screen that allows to enable or disable it. Maps that utilize a lot of macros should benefit greatly from turning macro expanding off performance wise.
5.2.27 Improved debug layout
In the frontend debug functionality, SQL query formatting has been improved for better readability.
5.2.28 Allow deleting trigger dependencies during mass update
If no trigger dependencies are added and their controlling checkbox is marked in the trigger mass update, all dependencies for selected triggers will be removed now.
5.2.29 New and updated translations
5.2.29.1 New translations
- Turkish
5.2.29.2 Updated translations
- Czech
- Dutch
- French
- Greek
- German
- Japanese
- Latvian
- Polish
- Ukrainian
- Russian
- Spanish
5.3 New and improved items
5.3.1 Item descriptions added
...and 'description' is now 'name'
Added {ITEM.DESCRIPTION} and {ITEM.KEY} macros.
5.3.2 Improved items
system.localtime key now supports parameters:
- utc (default) - returns Unix timestamp like before;
- local - returns time in the 'yyyy-mm-dd,hh:mm:ss.nn,+hh:mm' format
net.tcp.dns and net.tcp.dns.query have been renamed to net.dns and net.dns.record, respectively. Old syntax still supported as an alias. They are also now supported on Windows.
Additional functionality:
- IP as the first parameter is not ignored anymore, thus it is possible to specify different DNS server than localhost
- Both items gained ability to specify timeout and retry count (not supported on Windows)
- net.dns gained support for specifying DNS record type like A, CNAME and MX (net.dns.record already supported that). See item documentation for more information
net.tcp.service and net.tcp.service.perf now support https and telnet.
system.cpu.util on Solaris was unified with other platforms - kernel parameter was changed to system and wait parameter was changed to iowait.
system.cpu.num is now supported for OSX
system.cpu.load now accepts percpu as the first parameter - if specified, total load divided by online CPU count is returned (default is still all and returns normal load value)
vm.memory.size now supports more modes for various platforms. See supported by platform and vm.memory.size parameters pages for more information.
5.3.2.1 Skipping older data in log monitoring
added optional suppressing of processing of older data in log[], logrt[] and eventlog[]
additional parameter mode controls this:
- all (default)
- skip (skipping processing of older data)
5.3.2.2 Simple check format changed
The format of simple checks has been changed. The possibility of using IP addresses in simple checks has been added. The upgrade process converts all existing simple checks.
5.3.2.3 Ability to send empty strings
User parameters, external checks and other item types that return text (character, log, text types of information) now may send an empty string which will be accepted as a valid value. Before this, an empty value returned by an user parameter or external check would be treated as an unsupported item, and ignored for other item types by the Zabbix server.
5.3.2.4 External check parameter changes
External check parameter handling was changed. Previously, only one parameter was accepted. Starting with Zabbix 2.0, the key syntax conforms to other types of items and multiple comma-separated parameters may be passed.
Additionally, the hardcoded first parameter {HOST.CONN} for external checks has been removed and now external check parameters may be fully customised. Upgrade process adds this macro as a first parameter to all existing external checks.
5.3.2.5 Multi-line value support for external checks
Multi-line values can now be stored for the output of external scripts.
5.3.2.6 Time postfix support in aggregate items
Aggregate items now support time postfixes.
5.3.3 New items
- vfs.file.contents[] allows to retrieve full file contents with each check (limited to 64KB, will turn unsupported if file is bigger)
Items that are especially useful for automated inventory data collection:
- system.hw.chassis[full|type|vendor|model|serial] - default is [full], root permissions needed
- system.hw.cpu[all|cpunum,full|maxfreq|vendor|model|curfreq] - default is [all,full]
- system.hw.devices[pci|usb] - default is [pci]
- system.hw.macaddr[interface,short|full] - default is [all,full], interface is regex
- system.sw.arch
- system.sw.os[name|short|full] - default is [name]
- system.sw.packages[package,manager,short|full] - default is [all,all,full], package is regex
A status item has been removed as it was not easy to use and understand. Instead, a new internal item - zabbix[host,<type>,available] has been added. It allows to properly monitor host availability by each of states - Zabbix agent, SNMP, IPMI, JMX - and returns values for available, unavailable and unknown. The database upgrade process doesn't convert all existing 'status' keys and associated triggers to the new syntax, so they have to be converted manually.
5.4 Daemon performance improvements
5.4.1 Improved housekeeper performance on PostgreSQL
5.4.2 Caching of general configuration
Multiple general configuration parameters that previously were only read upon server startup are now also stored in the configuration cache. They are updated together with common configuration cache update.
- Refresh unsupported items
- Discovery group
- Custom severity names
- For how long alerts are stored
- For how long events are stored
Refresh unsupported items is now also synchronised to the Zabbix proxy.
5.4.3 Trigger cache
Trigger cache has been introduced. Currently it holds the following information about triggers:
- description
- expression
- error
- severity
- type
- value
- value_flags
Trigger cache is part of the configuration cache and is updated the same way and at the same time as other parts of it. Note that upgrading to 2.0.0 may increase configuration cache usage, especially if Zabbix instance has lots of triggers.
This should improve trigger related operation performance and reduce the load on the database.
5.4.4 User macro caching improvements
In Zabbix 1.8, individual daemon processes (for example, pollers) cache user macros and update this information every 5 minutes. In Zabbix 2.0, user macros are included in the general configuration cache and updated every CacheUpdateFrequency seconds.
5.4.5 Improved history (DB) syncer and escalator performance
The amount of work history syncer and escalator processes have to do for escalations has been reduced, which resulted in improved performance when processing large amount of events.
5.5 Other improvements
5.5.1 Nanosecond support
5.5.2 Database integrity
5.5.2.1 Database creation
Order of database file import has been changed - images must be imported before data.sql now.
5.5.3 Improved active agent auto-registration
Active agent auto-registration now supports monitoring added hosts with passive checks. When active agent asks for checks, if it has configuration parameters ListenIP or ListenPort defined in the configuration file, these are sent along to the server. If multiple IP addresses are specified, the first one is sent to the server.
Server, when adding a new auto-registered host, uses received IP address and port to configure the agent. If no port value is received, 10050 is used. If no IP address value is received, the one used for incoming connection is used.
For active agent auto-registration notifications there are also two new macros supported:
{HOST.IP}(or its deprecated version{IPADDRESS}){HOST.PORT}
5.5.4 Automatic filling of DNS names
For network discovery and active agent autoregistration, host DNS entry is now populated by doing a reverse lookup from Zabbix server or Zabbix proxy, if discovery is performed by a proxy.
5.5.5 Event redesign
The way Zabbix handles unknown events has been redesigned. Before, in Monitoring → Events section, if event flow was OK → UNKNOWN → OK, hiding unknown events would display two successive OK events. Starting with 2.0.0, only the oldest OK event would be display in such a case. An exception is triggers with "Multiple PROBLEM events" - for these, multiple successive events would be always shown.
(should document how acknowledges work from server & frontend side)
Trigger status UNKNOWN has been removed - triggers will always be in OK or PROBLEM state, although they might get additional unknown status. This status will only be used for informational purposes.
5.5.6 Supported macro changes
5.5.6.1 Common macros
In interface IP and DNS fields the following macros are supported:
- {HOST.HOST} (or its deprecated version {HOSTNAME})
- {HOST.NAME}
- {HOST.CONN}
- {HOST.DNS}
- {HOST.IP} (or its deprecated version {IPADDRESS})
In trigger names, additional following macros are supported:
- {HOST.HOST} (or its deprecated version {HOSTNAME})
- {HOST.NAME}
- {HOST.CONN}
- {HOST.DNS}
- {HOST.IP} (or its deprecated version {IPADDRESS})
5.5.6.2 User macro support
For 2.0, user macros can now be used in these additional locations:
- Hosts:
- Interface IP/DNS
- Interface port
- Passive proxy
- Interface port
- Items
- SNMPv3 security name
- SNMPv3 auth pass
- SNMPv3 priv pass
- SNMPv1/v2 community
- SNMPv1/v2 OID
- DB monitor additional parameters
- SSH username
- SSH public key
- SSH private key
- SSH password
- SSH script
- Telnet username
- Telnet password
- Telnet script
- Calculated item expression
- Discovery
- SNMPv3 security name
- SNMPv3 auth pass
- SNMPv3 priv pass
- SNMPv1/v2 community
- SNMPv1/v2 OID
Additionally, macro {TRIGGER.KEY<1-9>} has been renamed to {ITEM.KEY<1-9>}.
5.5.7 Boolean item type
New item type has been added - boolean. It translates textual representation into either 0 or 1. All values are matched in a case-insensitive way. TRUE is stored as 1 and FALSE is stored as 0. Currently recognised values are:
| TRUE | FALSE |
|---|---|
| true | false |
| t | f |
| yes | no |
| y | n |
| up | down |
| running | unused |
| enabled | disabled |
| available | unavailable |
Additionally, any non-zero numeric value is considered to be TRUE and zero is considered to be FALSE.
5.5.8 API access changes
User group access property "API access" has been removed. Starting with Zabbix 2.0, all users have full access to the API.
5.5.9 Unified time format
In previous versions of Zabbix, specifying time till midnight differed depending on the location - in some locations it was "23:59", in others - "24:00". Starting with Zabbix 2.0 this has been unified so midnight is always specified as "24:00".
5.5.10 "Host profiles" renamed to "host inventory" and merged
Before, Zabbix hosts had "normal" and "extended" profile. In Zabbix 2.0 both profiles were merged into single "host inventory".
5.5.11 Escalations enabled by default
Starting with Zabbix 2.0, escalations are always enabled and can not be disabled. By default a condition "Trigger value = PROBLEM" is added to new actions, so only problem notifications are sent. This makes recovery message checkbox operate in a more intuitive way. This action condition can be removed by the user.
5.5.12 Remote command improvements
Specify IPMI as a type instead of obscure syntax
Execute custom global scripts
Execute SSH and telnet commands
For custom scripts, ability to execute on the Zabbix server or agent was added
5.5.13 Changed default locations
5.5.13.1 Configuration files location
Before 2.0 this was hard-coded to /etc/zabbix . Since 2.0 the default changed to /usr/local/etc and depends on compile-time installation variable sysconfdir (which was ignored before Zabbix 2.0).
5.5.13.2 External scripts location
Before 2.0 the default location for external scripts was /etc/zabbix/externalscripts . Since 2.0 this changed to /usr/local/share/zabbix/externalscripts and depends on compile-time installation variable datadir. This location can be changed using configuration parameter ExternalScripts (server and proxy).
5.5.13.3 Alert scripts location
Before 2.0 the default location for alert scripts that are used for actions was /home/zabbix/bin . Since 2.0 this changed to /usr/local/share/zabbix/alertscripts and depends on compile-time installation variable datadir. This location can be changed using configuration parameter AlertScriptsPath (server).
5.5.14 Configuration files and directories added during installation
If you are using a packaged version of Zabbix the following information can be irrelevant because the locations might depend on a distribution policy.
When installing Zabbix the following configuration files are created if missing:
- /usr/local/etc/zabbix_server.conf
- /usr/local/etc/zabbix_proxy.conf
- /usr/local/etc/zabbix_agent.conf
- /usr/local/etc/zabbix_agentd.conf
/usr/local/etc is default value of compile-time installation variable sysconfdir.
The following directories are created for includes:
- /usr/local/etc/zabbix_server.conf.d
- /usr/local/etc/zabbix_proxy.conf.d
- /usr/local/etc/zabbix_agent.conf.d
- /usr/local/etc/zabbix_agentd.conf.d
These directories are not automatically handled as "Include" directories, you would have to set them in appropriate configuration file.
The following directory is created when installing server or proxy:
- /usr/local/share/zabbix/externalscripts
The following directory is created when installing server:
- /usr/local/share/zabbix/alertscripts
/usr/local/share is default value of compile-time installation variable datadir.
5.5.15 Unsupported item information sent by proxies
Information about unsupported items is now passed from Zabbix proxies to the server.
5.5.16 Simplified ServerActive logic
Zabbix agent daemon parameter ServerActive has been simplified. Instead of overriding Server parameter, ServerActive now is the only parameter that's used for active checks. Additionally, ServerPort parameter has been removed - host ports now should be specified in the ServerActive parameter.
See the "See also" section at the bottom of this page to read more details about these changes.
5.5.17 Simplified Zabbix agent daemon configuration
Zabbix agent daemon configuration has been simplified by removing DisableActive and DisablePassive parameters. Instead, not specifying ServerActive will not do any active item processing, and specifying StartAgents=0 will disable processing of incoming connections for passive items.
5.5.18 Monitoring of files larger than 2GB
While Zabbix did offer monitoring of files larger than 2GB before, this support was not consistent - it varied by platform and by item. Since 2.0, support for files exceeding 2GB is available also on 32-bit systems in all components, including tasks like logfile monitoring, file size monitoring etc. See large file support section for more information.