
- 5 Zabbix 4.0.0 新特征
- 立即检查监控项值
- 新的 HTTP 监控项类型(New HTTP item type)
- 监控项原型可以依赖于常规的监控项
- LLD 自动发现宏在监控项预处理中的使用
- 更灵活的主动式 Agent 自动注册
- 支持 MySQL 8.0(MySQL 8.0 supported)
- Elasticsearch 配置基于日期的索引
- 更安全的 Proxy 连接
- 问题事件的严重级别可以修改
- 问题事件相关
- 重新设计的时间选择器(Time selector redesign)
- 仪表盘的 Kiosk 模式(Kiosk mode for dashboards)
- 问题事件紧凑视图(Compact view of problems)
- 前端页面中的 监测中 → 触发器已移除(Monitoring → Triggers removed)
- 资产macro支持事件标签(Inventory macro support in event tags)
- Preventing unit conversion flexibly
- 支持在一个用户媒介中指定多个电子邮件地址(Multiple emails in one user media)
- 实时导出事件、监控项采集值和趋势数据(Real-time export of events, values, trends)
- Tag-based permissions
- 更好的 Zabbix server-proxy 通信压缩(Compression for server-proxy communication)
- 改进的数据库关闭消息(Improved database down messages)
- 使用 "not" 关键字(Use of "not" keyword)
- 监控项(Items )
- 触发器(Triggers)
- 前端(Frontend)
- 改进的必填字段标识(Mandatory fields marked)
- 改进的键盘导航(Keyboard navigation)
- 重新设计的日期选择器(Date picker redesign)
- 重新设计的颜色选择器(Colour picker redesign)
- 弹出式窗口已由遮罩层对话框 overlay dialogs 替换(Popup windows replaced by overlay dialogs)
- 过滤器(Filtering)
- 重新命名的小部件、图形元素和报告(Renamed widgets, screen elements and reports)
- 可以自定义的事件状态颜色(Changes in "Trigger displaying options" form)
- 更便捷的“主机批量操作”表单(Changes in "Host mass update" form)
- 更灵活的“用户媒介”表单(Changes in "User media" form)
- 双选框已替换为自动选择框(Twin boxes replaced with auto-select)
- 改进的小部件配置(Improved widget configuration)
- 增强的小部件中的图形显示(Graph visual improvements in a widget)
- 改进的纯文本小部件(Changes in Plain text widget )
- 改进的前端顶部栏菜单(Frontend top bar menu improvements)
- 改进的无障碍功能(Accessibility)
- 可配置的会话 Cookie 名称(Configurable session cookie name)
- 其他的一些更改(Miscellaneous)
- 宏(Macros)
- Agent 守护进程(Daemons)
- 性能(Performance)
- Logging
- API 改进(API improvements)
- Macros
- Daemons
- Performance
- Logging
- API improvements
- See also
5 Zabbix 4.0.0 新特征
立即检查监控项值
在 Zabbix 中,一直以来都是根据配置的更新轮询时间,周期性检查新的监控项的值。大多数更新轮询周期非常短,但仍有一些更新轮询周期较长的(包括低级别发现规则),因此,在实际场景中,可能需要更快速地检查新的监控项值,比如立即收集可发现资源的变化。
在 Zabbix 的新版本中,这一功能得到优化,通过在下列两个位置点击Check now按钮,即可实现:

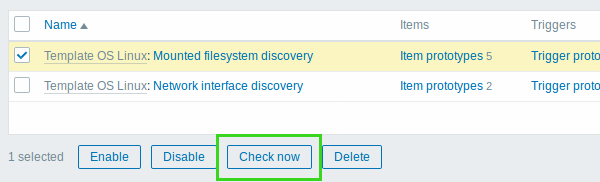
<note warning>检查一个新的监控项值时,配置缓存没有更新,因此,检测到的值不会反应监控项/发现规则配置的最新变化。因此,这种方式也不能检查刚刚创建的监控项/规则的值。 :::
关于更多信息,详见 Check now。
新的 HTTP 监控项类型(New HTTP item type)
在新版本中,引入了一个新的HTTP监控项类型用于允许通过HTTP/HTTPS协议的数据轮询。使用Zabbix sender或者Zabbix sender协议也支持Trapping功能。
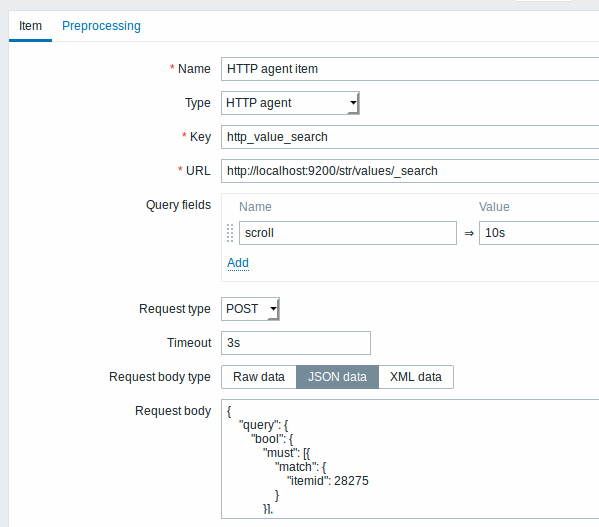
关于更多信息,详见 HTTP agent 监控项类型。
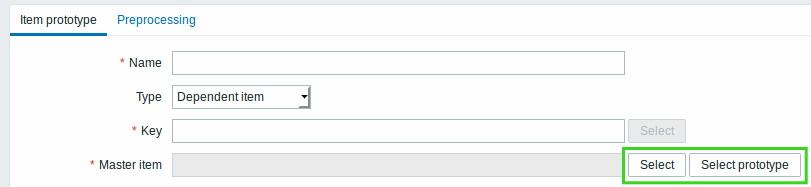
监控项原型可以依赖于常规的监控项
Zabbix 3.4 引入了监控项依赖和监控项原型依赖,可以从主监控项收集的批量指标中提取数据。 然而,以前监控项原型只能依赖于来自相同 LLD 规则的另一个监控项原型。 在新版本中,这一限制已解除。 项目原型可以依赖于另一个监控项原型或来自同一主机的常规监控项。
当为原型选择“主要项”时,前端现在有两个按钮 - 一个用于选择常规主监控项,另一个用于选择原型主监控项。
LLD 自动发现宏在监控项预处理中的使用
LLD 自动发现宏现在可以被用于监控项原型的监控项预处理步骤。
Low-level discovery macros now can be used in item preprocessing steps for item prototypes.
用户宏和具有上下文的用户宏可用于常规监控项和监控项原型的监控项预处理步骤。
User macros and user macros with context can be used in item preprocessing steps for regular items and item prototypes.
更灵活的主动式 Agent 自动注册
以前自动注册只运行一次,这对于当主机上的某些内容发生变化时的情况没有太大的灵活性。 在新版本中,如果主机元数据(Agent 配置文件中的 HostMetadata、HostMetadataItem 参数发生变化),则会重新运行自动注册。
这允许基于主机上的变化的特性来调整监控。为了使这种更灵活的方法发挥作用,自动注册动作现在支持其他操作:
- 移除主机
- 启用主机
- 从主机群组中移除主机
- 取消与模版的链接
支持 MySQL 8.0(MySQL 8.0 supported)
现已添加对 MySQL 8.0 的支持。
Elasticsearch 配置基于日期的索引
为了能在Elasticsearch中正确筛选历史数据,每个数据类型需要添加多个索引。新版本中支持设置为基于日期的索引。详见见Elasticsearch 配置。
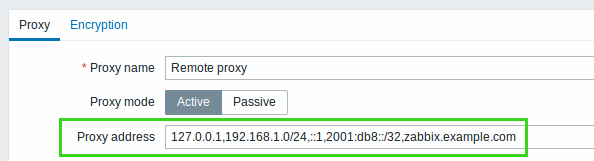
更安全的 Proxy 连接
现在可以以更安全的方式为主动式 Proxy 代理和被动式 Proxy 代理配置连接:
- 现在可以限制主动式 Agent 代理的允许连接地址范围。 在前端配置主动式 Proxy 代理时,会出现一个名为 Proxy address 的新字段。 如果指定此字段,则仅从主动式 Proxy 代理指定的 IP 地址/ DNS 名称列表中接受主动式 Proxy 代理请求。
- 被动式 Proxy 代理 配置文件中的 Server 参数现在是必需的了,在之前是可以忽略的。如果指定了此参数,那么被动 Proxy 代理将拒绝 Server 参数中未列出的地址。
问题事件的严重级别可以修改
之前版本中,问题事件严重级别始终取决于原触发器的严重级别,无法单独更改。新版本中,数据库Event 表中的问题严重级别是一个单独的字段,支持更改。 其原始值还是基于触发器严重性,可以在问题更新窗口进行更新。
问题事件相关
问题更新窗口
问题更新 窗口是之前 Zabbix 版本中的“确认事件”窗口的重构版本。
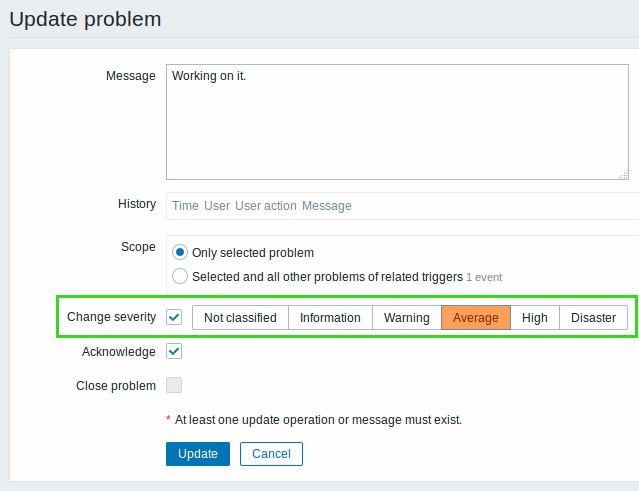
其除了重命名之外,还进行了以下更改:
- 现在可以在事件级别中更改问题事件的严重性级别;
- 每个问题更新操作都可以独立完成:
- 您可以在不确认问题的情况下发表评论;
- 您可以在不发表评论的情况下确认问题;
- 您可以手动关闭问题,而无需确认、评论等。
- 您可以为这些操作定义其操作涉及的范围:Change severity、Acknowledge、Close problem;
- 其历史记录列出了有关该问题的先前活动和评论,以及时间和用户详细信息。
其他更改
- 显示的问题严重性现在是事件严重性级别,可以在如下位置更改:
- 在前端页面 监测中 → 问题 的“动作”列中显示的内容已经展开。此前它只有关于动作过程的文字信息,而现在则已符号(图标)来展示。除了“动作”之外,还显示有关评论和更改问题严重性级别等活动的信息。在将鼠标滑过图标时,会弹出一个窗口,该窗口包含有关每个活动的详细信息。
- 以前在 事件细节 中有单独的窗口用于确认、消息动作和命令动作操作。现在,关于问题的所有活动都显示在一个窗口,该窗口中的符号图标用于全面展示问题生命周期的每个阶段,包括问题生成和问题关闭的条目,都有其相应的符号图标得以呈现;
- 以前在动作中的“确认操作”已经被重命名为 更新操作;
- 现在将始终启用事件确认(以前是 管理 → 一般 → 界面设置) 的 启用事件确认 复选框);
- 现在一些相关的 宏
已被更新:
- {ACK.DATE} 重命名为 {EVENT.UPDATE.DATE}
- {ACK.TIME} 重命名为 {EVENT.UPDATE.TIME}
- {ACK.MESSAGE} 重命名为 {EVENT.UPDATE.MESSAGE}
- {EVENT.ACK.HISTORY} 重命名为 {EVENT.UPDATE.HISTORY}
- 新添加 {EVENT.UPDATE.ACTION}
- 新添加 {EVENT.SEVERITY}
- 新添加 {EVENT.NSEVERITY}
- 在动作中的操作、恢复操作、确认操作的消息内容中,默认会显示此次更改的宏。
重新设计的时间选择器(Time selector redesign)
时间段选择器已经过重新设计,目的是为用户提供一键式的操作来选择经常需要的时段。
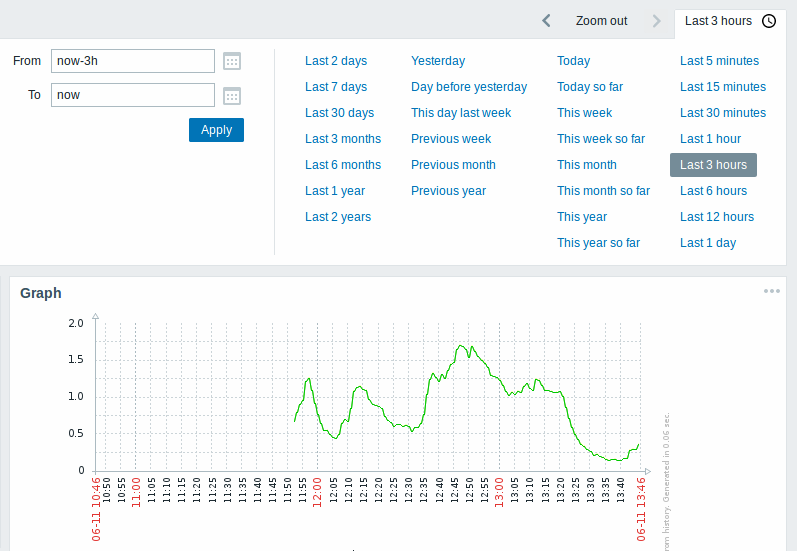
也可以缩小选定的时间段(在两个方向上点击以增加两倍或减少 0.5 倍),或来回移动时间段,并从日期选择器中选择更具体的日期。
得益于时间选择器的重新重新设计,下面位置也将应用新的时间选择器:
- 监测中 Monitoring → //仪表盘 Dashboard // (图形小部件 graph widget)
- 监测中 Monitoring → 问题 Problems (在过滤器选择了历史记录的情况下 with History selected in the filter)
- 监测中 Monitoring → Web 监测 Web (in scenario details)
- 监测中 Monitoring → 最新数据 Latest data (item graph, item history, ad-hoc graph, templated screens)
- 监测中 Monitoring → 图形 Graphs
- 监测中 Monitoring → 聚合图形 Screens
- 监测中 Monitoring → 聚合图形 Screens (幻灯片放映 slideshows)
- Reports → Audit
- Reports → Action log
详见 时间段选择器。
仪表盘的 Kiosk 模式(Kiosk mode for dashboards)
在新的
kiosk模式中,仅显示仪表盘部件内容,周边多余元素一律不显示,当处于全屏模式下时,可以点击 按钮进入 Kiosk 模式。
| < | |||
|---|---|---|---|
| < | |||
问题事件紧凑视图(Compact view of problems)
在 监测中 → 问题 中添加了 紧凑视图 模式, 允许最大程度一览其发生的事件条目:
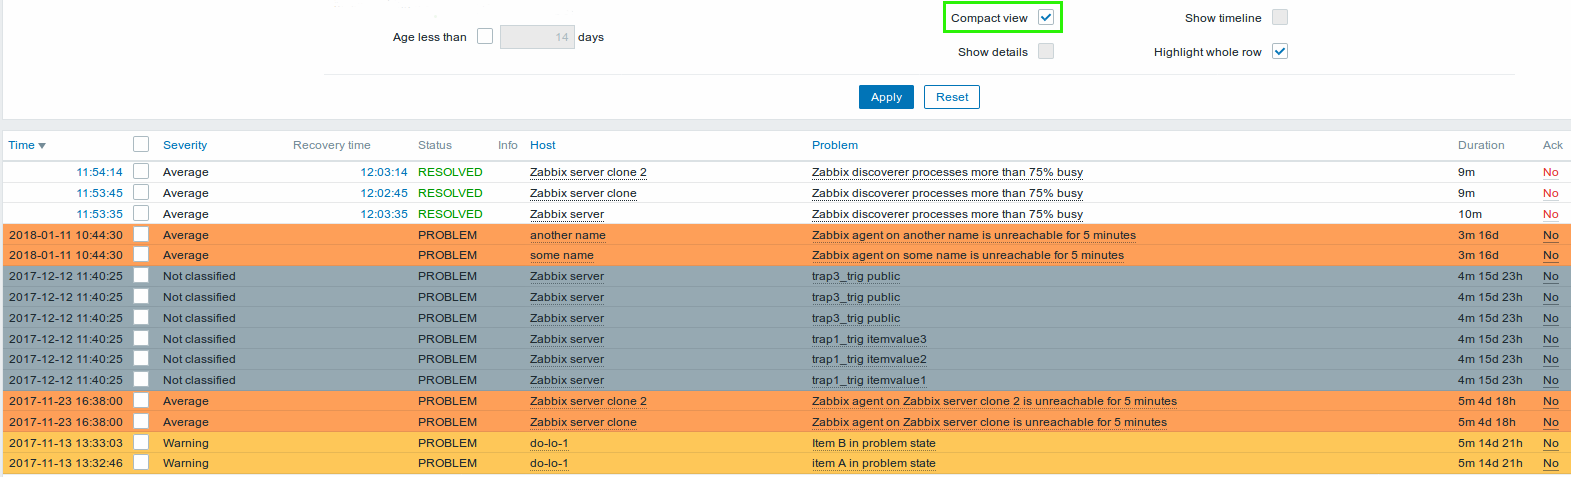
可以通过在过滤器中选择紧凑视图复选框即可查看。
在 问题页面的过滤器 中增加了另外两个新选项:
- 整行Highlight显示 允许使用问题严重性级别的颜色以突出显示整行未解决的问题。此选项仅适用于标准的蓝色和黑色主题,高对比度主题并不适用。
- 时间轴显示 允许显示或隐藏时间轴。此复选框也同时添加到 问题 仪表盘小部件配置中。值得注意的是,当选中 紧凑视图 时,此选项不可用。
前端页面中的 监测中 → 触发器已移除(Monitoring → Triggers removed)
由于考虑到触发器状态可以在 监测中 → 问题 中查看,因此决定在“监测中”菜单移除 触发器 部分。
As trigger status can be viewed primarily in Monitoring → Problems, it has been decided to remove the Triggers section from the Monitoring menu.
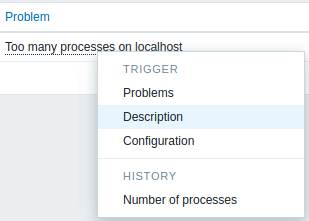
现在可以在 监测中 → 问题 的具体问题中点击,并在弹出的 触发器 上下文访问触发器的描述。
Trigger descriptions can now be accessed from the Trigger context menu and are opened in a popup window.
资产macro支持事件标签(Inventory macro support in event tags)
{INVENTORY.*} 宏 现在已支持关联基于触发器的 事件关联 的事件标签。
事件标签中资产宏的扩展可以关联到事件(即问题及其解决方案),例如,通过数据中心位置、其负责的系统管理员、机架号和所提供的任何其他库存项目,从而为管理员提供更多自动化的可能性。
Preventing unit conversion flexibly
在 Zabbix 中为监控项指定单位会导致传入值异常的转换单位显示 - 例如,当指定单位为“B”,其传入值“2048”将显示为“2KB”。在以前的 Zabbix 版本中,阻止这类转换的单位黑名单包括“ms”、“rpm”、“RPM”、“%”,它们是被写死的。
Specifying a unit for an item in Zabbix results in a multiplier prefix
being added - for example, an incoming value '2048' with unit 'B' would
be displayed as '2KB'. The unit blacklist for which such conversion was
prevented in previous Zabbix versions was hardcoded and consisted of
ms, rpm, RPM, %.
但在新版本中,可以使用前缀“!”来防止任何单位被转换,例如“!B”。为了更好地说明此转换如何使用和不使用,请参阅以下值和单位示例:
In the new version, any unit can be prevented from being converted by
using a ! prefix, for example !B. To better illustrate how this
conversion works with and without the blacklisting, see the following
examples of values and units:
1024 !B → 1024 B
1024 B → 1 KB
61 !s → 61 s
61 s → 1m 1s
0 !uptime → 0 uptime
0 uptime → 00:00:00
0 !! → 0 !
0 ! → 0虽然之前的单位黑名单仍然可以使用,但现在已弃用,因此防止这些单位转换的正确写法现在是!ms、!rpm、!RPM和!%。
Even though the previous unit blacklist also still works, it is now
deprecated, so the correct way to prevent conversion for these units is
now !ms, !rpm, !RPM, !%
支持在一个用户媒介中指定多个电子邮件地址(Multiple emails in one user media)
现在可以在一个 用户媒介 中指定多个电子邮件地址。
Multiple e-mail addresses can now be specified in one user media entry.
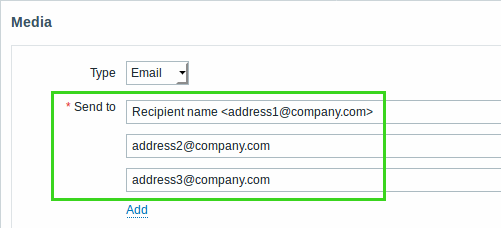
如果以这种方式指定多个电子邮件地址,则会向所有指定的收件人发送一封电子邮件。
If multiple e-mail addresses are specified this way, one e-mail will be sent to all the specified recipients.
实时导出事件、监控项采集值和趋势数据(Real-time export of events, values, trends)
通过在服务器配置文件中指定新的“ExportDir”参数,可以以换行符分隔的 JSON 格式实时导出触发事件、监控项采集值和趋势数据。 另一个新参数 “ExportFileSize”可用于确定单个导出文件的最大允许大小。
Tag-based permissions
用户群组 表单已重构完成,其中包含新添加的 标签过滤器选项卡 。该选项卡允许为用户组设置基于标签的权限,并查看按标签名和其值过滤的问题:
User groups form has been completed with a new Tag filter tab that allows to set tag-based permissions for user groups to see problems filtered by tag name and its value:
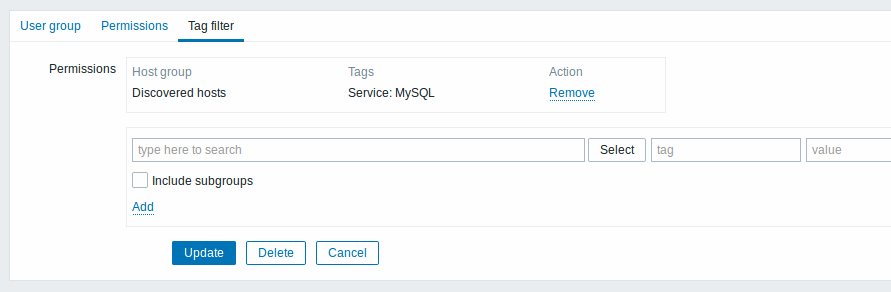
此更改适用于管理 → 用户群组 中的“用户群组”表单。
This change applies to the "User groups" form in Administration → User groups.
更好的 Zabbix server-proxy 通信压缩(Compression for server-proxy communication)
现在,Zabbix server 和所有 proxy(反之亦然)的所有通信都是无条件压缩的。压缩可以降低带宽需求并提高数据传输速度。
All communications between Zabbix server and all proxies, and vice versa are now unconditionally compressed. Compression lowers the bandwidth requirements and improves data transfer speed.
在 管理 → 代理 表单通过名为“压缩”的附加列进行了扩展。
The Administration → Proxies form is extended with an additional column named "Compression".
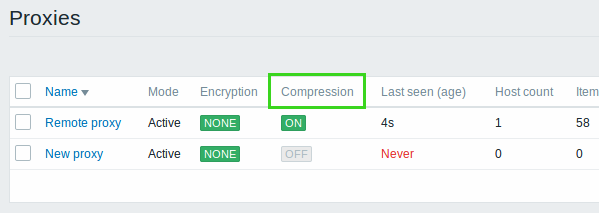
其压缩功能需要 Zlib 库的支持。
Zlib library is required for compression support.
改进的数据库关闭消息(Improved database down messages)
数据库关闭消息已得到改进,以提供有关已发生问题的更多详细信息。从现在开始,数据库关闭消息包含以下内容:
Database down messages have been improved to provide more details about the occurred problem. Database down message from now on consists of the following content:
[MySQL|PostgreSQL|Oracle|IBM DB2] database <DB Name> [on <DB Host>:<DB Port>] is not available: <error message depending on the type of DBMS (database)> 如果将 <DB Host> 定义为空值,则不会将 <DB Host> 添加到消息中。如果默认值为("0"),则不添加 <DB Port>。
<DB Host> is not added to the message if it is defined as an empty value and <DB Port> is not added if it is the default value ("0").
使用 "not" 关键字(Use of "not" keyword)
现在支持在 自定义表达式 字段和 自动发现规则 过滤器下拉列表中使用“not”关键字。
Use of "not" keyword in Custom expression field and in a Discovery rule filter drop down is now supported.
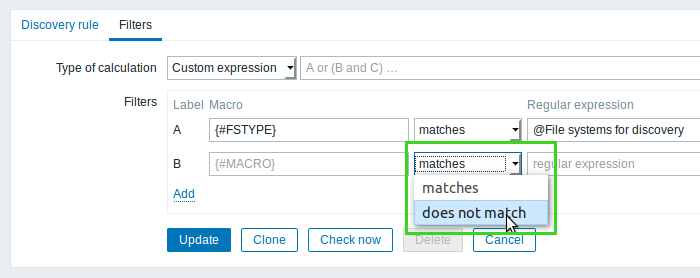
此更改适用于在 配置 → 事件关联 中的 事件关联规则 表单、配置 → 动作 中的 动作 表单和 //自动发现规则 //过滤器。
This change applies to the Event correlation rules form in Configuration → Event correlation, Actions form in Configuration → Actions and Discovery rule filter.
监控项(Items )
新增的监控项(New items)
- 添加了 vfs.dir.count agent 监控项以递归计算给定目录中的所有条目。
- vfs.dir.count agent item has been added to recursively count all entries in the given directory.
已更新的监控项(Updated items)
- vm.memory.size agent 监控项 现在已支持 slab 参数。
- vm.memory.size agent item now supports a slab parameter.
- 以下 agent 监控项现在已支持新的 mode 值:
- The following agent
items now support new
mode values:
- net.if.total - overruns (fifo) 和 compressed
- net.if.in - overruns (fifo)、frame、compressed 和 multicast
- net.if.out -// overruns (fifo)、collisions (colls)、carrier// 和 compressed
- 对于 logrt 和 logrt.count 监控项,添加了 copytruncate 用于日志文件循环选项。
- For logrt and logrt.count items, a copytruncate log file rotation option has been added.
- 现在已支持这些值使用监控项值预处理 进行 布尔值转十进制 的转换:ok、master、err、slave。
- The following values are now supported in Boolean to decimal transformation for Item value preprocessing : ok, master, err, slave.
更好的 JMX 监控(JMX monitoring)
Zabbix ava gateway 现在支持使用返回非原始数据类型的自定义 MBean,它覆盖 toString() 方法。
Zabbix Java gateway now supports working with custom MBeans returning non-primitive data types, which override the toString() method.
改进的外部检查脚本的执行(Execution of external check script)
在新版本中,当完成
外部检查脚本
后,参数将被包装为单引号 ' 而不是双引号 "。此更改允许 Zabbix
在外部检查参数的名称中接受更多符号。例如, $ 符号将不再被忽略。
Upon completion of an external check
script, arguments are wrapped
to single quotes ' instead of double quotes ". This change
allows Zabbix to accept more signs in an external check parameter's
name. For example, the $ sign is no longer ignored.
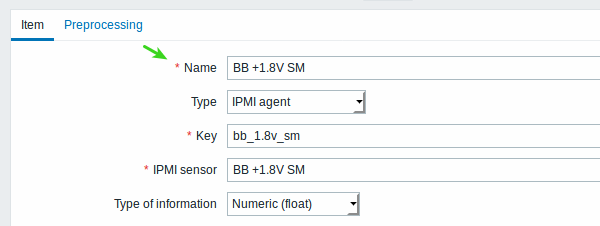
通过全名来搜索 IPMI 传感器(Searching IPMI sensor by full name)
在 IPMI 监控项
的 IPMI 传感器 字段中,现在可以通过在值之前使用 name:
前缀来指定搜索全名。
In the IPMI sensor field for IPMI
items it is now
also possible to specify a search for the full name, by using a name:
prefix before the value.
触发器(Triggers)
基于时间的触发器函数已由 history syncers 处理(Time triggers processed by history syncers)
基于时间的触发器 函数 如
nodata()、 date()、 dayofmonth()、 dayofweek()、 time() 和
now() 已从 timer processes 转为 history syncers 处理。
The processing of time-based trigger
functions such as nodata(),
date(), dayofmonth(), dayofweek(), time() and now() has been
moved from timer processes to history syncers.
虽然以前所有基于时间的触发器都是同时重新计算的,但每30秒将创建一次峰值负载。而现在基于时间的触发器处理在30秒内均匀分布。
While previously all time-based triggers were recalculated at the same time, creating peak loads every 30 seconds, now the time-based trigger processing is evenly spread within those 30 seconds.
全面的 logsource 触发器函数(Miscellaneous)
- 现在,logsource 触发器函数 的参数值支持正则表达式和全局正则表达式。
- Regular expressions and global regular expressions are now supported in the parameter values of the logsource trigger function.
前端(Frontend)
改进的必填字段标识(Mandatory fields marked)
现在,所有 Zabbix 前端表单的必填字段现在都标有红色星号。
Mandatory fields in all Zabbix frontend forms are now marked with a red asterisk.
改进的键盘导航(Keyboard navigation)
- 现在可以通过按 Tab 键访问所有交互式元素( 拓扑图除外);
- All interactive elements (except maps) can now be accessed by pressing the Tab key;
- 弹出窗口现在可以通过键盘打开、使用和关闭;
- Popups can now be opened, worked with and closed by keyboard;
- 现在可以通过键盘箭头导航上下文菜单选项。 按 Esc 将关闭整个上下文菜单,按 Enter 将激活所选选项。
- Context menu options can now be navigated by keyboard arrows. Pressing Esc will close the whole context menu, while pressing Enter will activate the selected option.
- 可以通过键盘选择重新设计的日期选择器中的选择年、月和日期。
- Year, month and date can be selected by keyboard in the redesigned date picker.
重新设计的日期选择器(Date picker redesign)
现在,日期选择器已重新设计,允许通过键盘选择年、月和日期。

可以使用 Tab 和 Shift + Tab 在年/月/日期块之间切换。 允许通过键盘箭头或箭头按钮选择所需的值。 按Enter(或单击所需的值)激活所选。
选择时间的功能已从日期选择器中删除,转移到了更新版的时间选择器中。 完成按钮也会被删除,因为点击所选即可激活所选日期。 //立即生效 //按钮也已删除。
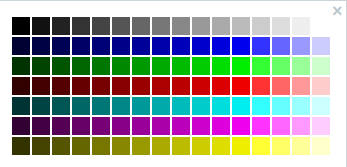
重新设计的颜色选择器(Colour picker redesign)
颜色选择器经过重新设计,提供更多的颜色选择:
 |
在 Zabbix 4.0 之后 |
 |
在 Zabbix 4.0 之前 |
弹出式窗口已由遮罩层对话框 overlay dialogs 替换(Popup windows replaced by overlay dialogs)
在新窗口中打开的所有弹出窗口现在都作为前端的遮罩层对话框(overlay dialogs)打开。
All popups that were opened in new windows are now opened as overlay dialogs across the frontend.
此外,取消 按钮已添加到这些窗口中。
Additionally, a Cancel button has been added to these windows.
过滤器(Filtering)
通过标签更灵活的过滤问题事件(More flexible problem filtering by tags)
通过事件标记名称、值和显示的标记数量,在问题过滤中添加了更多灵活性:
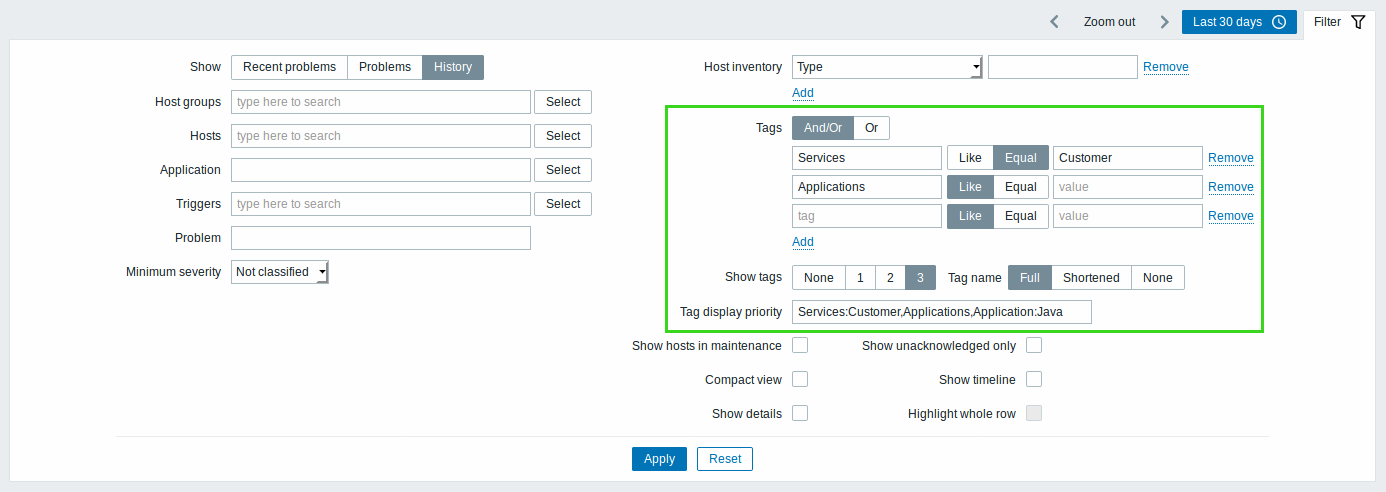
- 旧版本中必须满足所有条件,现在可以选择 And/Or 和 Or 计算类型;
- 此外,现在可以在不区分大小写和区分大小写的字符串匹配之间进行选择;
- 新版本中还添加了选择显示标签数量的选项。
这些更改适用于 监测中 → 问题 和 问题 仪表板小部件中的过滤器。
更灵活地过滤主机(Host list)
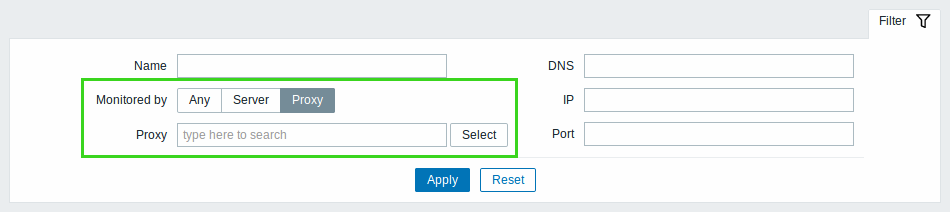
新版本中支持根据是否被Zabbix Server或Zabbix Proxy 监控来过滤主机。如果通过 Proxy 进行过滤,可以指定一个或多个Proxy。 默认情况下,选择 任何 选项后自动完成字段 Proxy 并不可见。 而选择 Proxy 时,过滤器中将显示带有 Proxy 标签的新生成的自动完成字段。
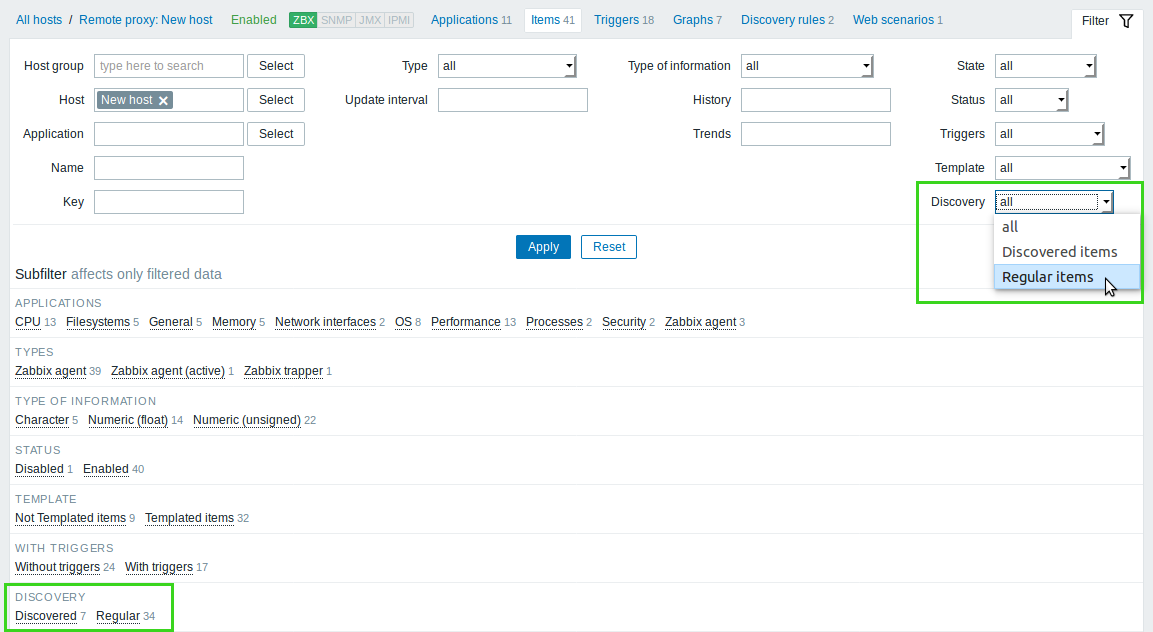
更灵活地过滤监控项(Item list)
现在可以根据是否由以下条件来过滤监控项:
You can now filter items depending on whether they are:
- 常规的监控项 - 手动创建或从模板创建;
- Regular items - created manually or from a template
- 自动发现的监控项 - 通过 LLD 自动发现规则创建。
- Discovered items - created by low-level discovery
重新命名的小部件、图形元素和报告(Renamed widgets, screen elements and reports)
以下元素现已重命名为:
The following elements have been renamed:
| 在 Zabbix 4.0.0 之前 ** | Zabbix 4.0.0 之后** |
| System status | Problems by severity |
| Host status | Problem hosts |
| Status of Zabbix | System information |
可以自定义的事件状态颜色(Changes in "Trigger displaying options" form)
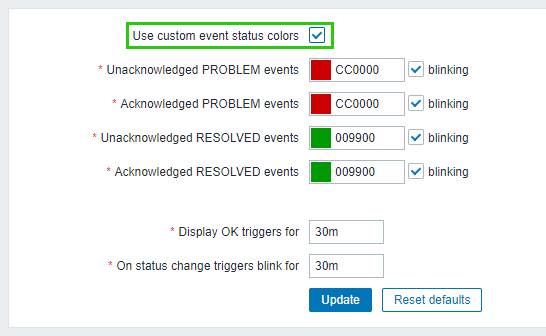
添加了新的 使用自定义事件状态颜色 复选框。从现在开始,根据当前选择的颜色主题将自动调整已确认/未确认事件的颜色。 如果需要,仍然可以激活此复选框来自定义这些颜色。
New checkbox Use custom event status colors added. From now the colors of acknowledged/ unacknowledged events are automatically adjusted according to currently selected color theme. It's still possible to customize these colors if it is required.
此更改适用于 管理 → 一般 中的 "触发器显示选项" 表单。
This change applies to the "Trigger displaying options" form in Administration → General.
更便捷的“主机批量操作”表单(Changes in "Host mass update" form)
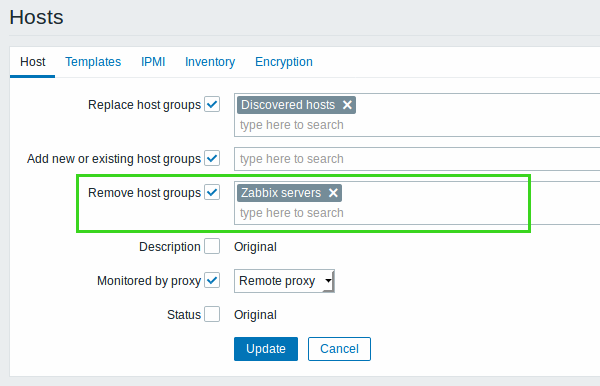
添加了新的复选框 删除主机组 并自动填写字段。 从现在开始,用户可以从主机中删除特定的主机组。如果主机已在选定的组中,则将从这些组中删除主机。如果主机不在选定的组中,则不会添加或删除任何内容。 如果同时替换和删除相同的主机组,则实际上主机没有主机组。
New checkbox Remove host groups and auto-complete field added. From now users are able to remove specific host groups from hosts. In case hosts are already in selected groups, then hosts will be removed from these groups. In case hosts are not in selected groups, nothing will added or removed. In case same host groups are replaced and removed at the same time, hosts are actually left without groups.
更灵活的“用户媒介”表单(Changes in "User media" form)

现在,如果选中报警媒介中的严重性级别,那么相应严重性级别将已设置好的颜色样式呈现,而非选中的严重性级别则将与表格背景颜色相同的颜色呈现。
Trigger severity active blocks are now styled in severity colors while inactive blocks have the same color as table background color.
此更改适用于在 管理 → 用户 → 用户资料 表单中的 "媒介" 选项卡和 用户资料配置 表单.
This change applies to the "Media" tab in Administration → Users → User properties form and User profile configuration form.
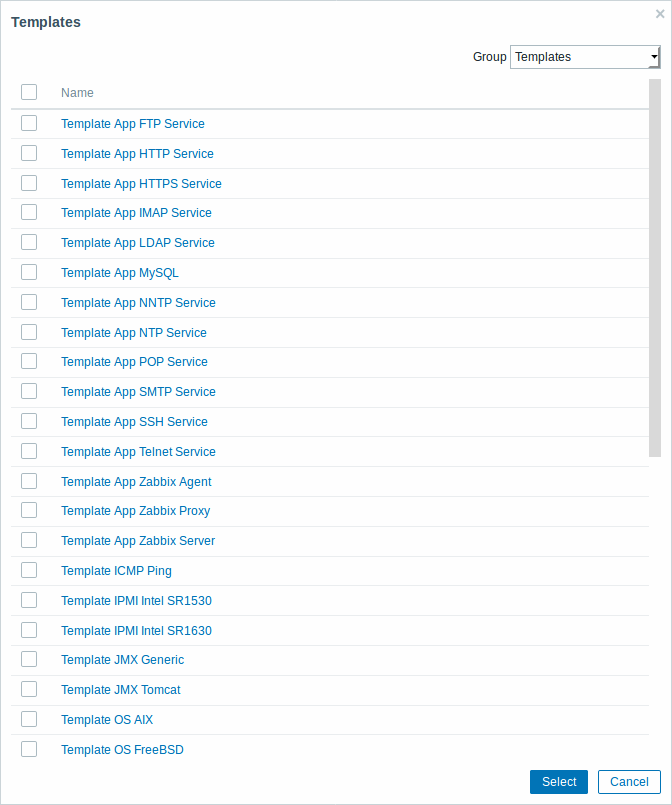
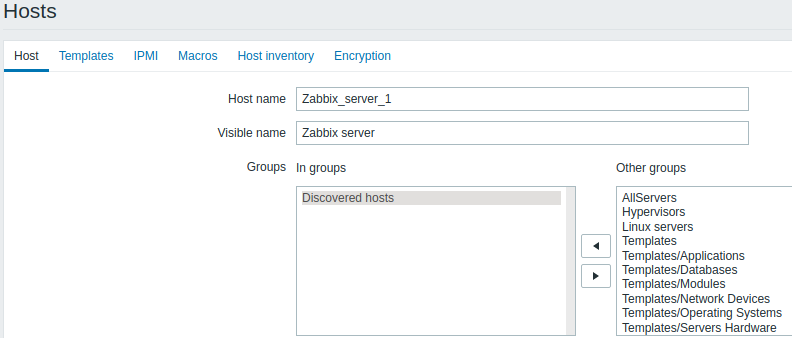
双选框已替换为自动选择框(Twin boxes replaced with auto-select)
 |
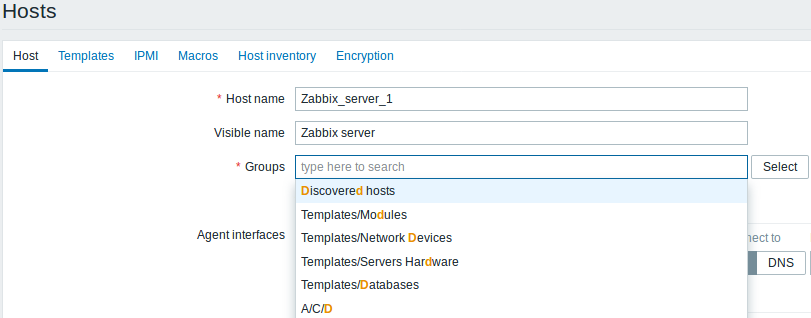 |
从现在开始,为了使一些表单更加友好和紧凑。 双选框控件现已删除,并替换为自动选择框。
From now some of the forms are much more user-friendly and compact. Twin box controls are now removed and replaced with auto-select.
此更改适用于以下配置表单:
This change applies to the following configuration forms:
- 配置 → 主机 → 创建/编辑主机和配置;
- Configuration → Hosts → Create/Edit host and Configuration;
- 配置 → 主机群组 → 创建/编辑主机群组;
- Configuration → Host groups → Create/Edit host group;
- 配置 → 维护 → 创建/编辑维护周期 → 主机&主机群组 选项卡;
- Configuration → Maintenance → Create/Edit maintenance period → Hosts & Groups tab;
- 配置 → 模板 → 创建/编辑模板;
- Configuration → Templates → Create/Edit template;
- 管理 → 用户群组 → //创建/编辑用户群组 //;
- Administration → User groups → //Create/Edit user group //;
- 管理 → Proxies → 创建/编辑 proxy.
- Administration → Proxies → Create/Edit proxy.
改进的小部件配置(Improved widget configuration)
当向仪表盘添加新的小部件或编辑现有小部件时,更改小部件类型会打开一个表单,根据新选择的小部件类型,其所有字段设置为默认值
When adding a new widget to a dashboard or editing an existing one, change of widget type opens a form with default values set for all fields depending on the type of newly selected widget.
增强的小部件中的图形显示(Graph visual improvements in a widget)
现在,小部件中的图形显示已得到增强。 生成的图形现在占用最大可能空间,允许显示更多信息。
Graph display in widgets has been enhanced. A generated graph is now occupying the maximum possible space allowing more information to be displayed.
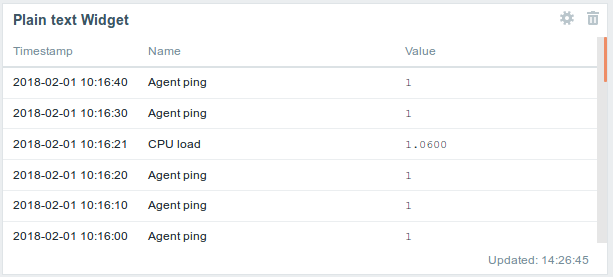
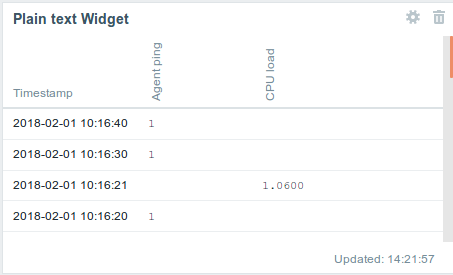
改进的纯文本小部件(Changes in Plain text widget )
现在可以在纯文本小部件配置期间添加多个监控项:
It is now possible to add multiple items during Plain text widget configuration:
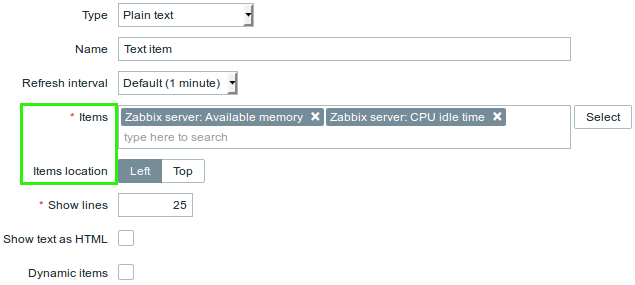
此外,还添加了监控项位置 选项,以选择窗口小部件中的信息显示方式:
Items location option has also been added to choose the way how information in the widget may be displayed:
| 左侧 顶 | |
 |
 |
改进的前端顶部栏菜单(Frontend top bar menu improvements)
重定向到 Zabbix 官方支持页面的新Support 按钮现已添加到 Zabbix 前端顶部栏菜单中:
A new Support button redirecting to Zabbix official support page is now added to Zabbix frontend top bar menu:

改进的无障碍功能(Accessibility)
Zabbix 前端已经进行了一些改进,以使其可用于 assistive technologies,并且通常情况下对视障人士更友好。
Several improvements have been made to Zabbix frontend in order to make it usable with assistive technologies and generally more friendly for visually-impaired people.
新增的高对比度主题(High-contrast themes)
在新版本中,为 Zabbix 前端添加了两套新的高对比度主题:
Two new high-contrast themes have been added for Zabbix frontend:
- 高对比度的明亮
- High-contrast light
- 高对比度的暗黑
- High-contrast dark
| < | |||
|---|---|---|---|
| < | |||
在此次开发中,暗黑主题中图形的默认颜色也已更新:
Within this development, default colours for graphs in the dark themes have also been updated:
- 在暗黑主题中创建新图形时,添加到图形中的监控项的颜色对比度会更高(已创建的图形不受影响)。
- When creating a new graph in the dark theme, there will be a higher contrast of colours for items added to the graph (already created graphs are not affected).
- 在暗黑主题中查看简单图形时,监控项的颜色将具有更高的对比度。
- When viewing simple graphs in the dark theme, colours for items will be in higher contrast.
屏幕阅读更加友好(Screen reader-friendly features)
- 屏幕阅读器现在可以读取顶级导航和用户级内容。
- Top-level navigation and user-level content is now readable by screenreader.
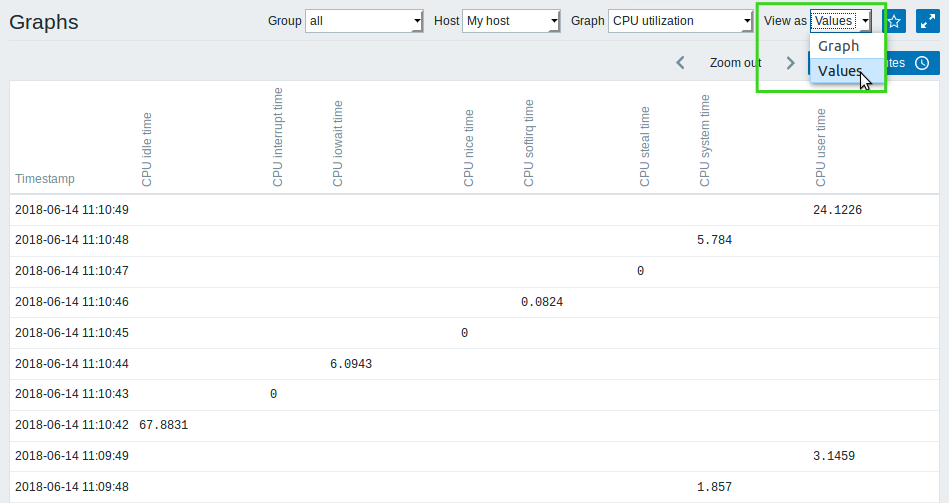
- 现在可以将图形的值视为表格中的文本,以便可以使用屏幕阅读器读取它。 此功能是针对 自定义图形 和 特设图形 实现的。
- It is now possible to view graph values as text in a table so that it can be read with a screen reader. This functionality is implemented for custom graphs and ad-hoc graphs.
- 多选字段可由屏幕阅读器管理。
- Multi-select fields can be managed by a screen reader.
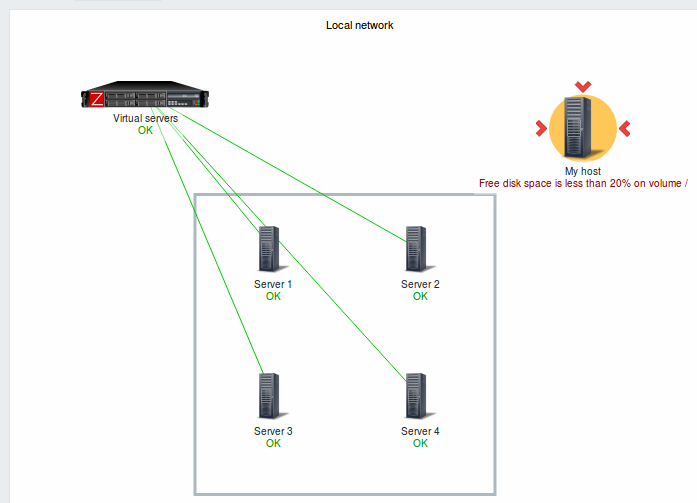
拓扑图中的摘要(Readable summary in maps)
现在,隐藏的“aria-label”属性已添加到拓扑图中,允许使用屏幕阅读器读取拓扑图信息。 通用拓扑图描述和单个元素描述均可用,格式如下:
A hidden "aria-label" property has been added to maps allowing map information to be read with a screen reader. Both general map description and individual element description is available, in the following format:
- 对于拓扑图描述:
<Map name>, <* of * items in problem state>, <* problems in total>. - for map description:
<Map name>, <* of * items in problem state>, <* problems in total>. - 对于描述具有一个问题的单个元素:
<Element type>, Status <Element status>, <Element name>, <Problem description>. - for describing one element with one problem:
<Element type>, Status <Element status>, <Element name>, <Problem description>. - 对于描述具有多个问题的单个元素:
<Element type>, Status <Element status>, <Element name>, <* problems>. - for describing one element with multiple problems:
<Element type>, Status <Element status>, <Element name>, <* problems>. - 对于描述毫无问题的单个元素:
<Element type>, Status <Element status>, <Element name>. - for describing one element without problems:
<Element type>, Status <Element status>, <Element name>.
例如,此描述是可用的:
For example, this description is available:
'Local network, 1 of 6 elements in problem state, 1 problem in total. Host, Status problem, My host, Free disk space is less than 20% on volume \/. Host group, Status ok, Virtual servers. Host, Status ok, Server 1. Host, Status ok, Server 2. Host, Status ok, Server 3. Host, Status ok, Server 4. '上面的描述用于此拓扑图:
for the following map:
改进的通知类型图标(Icons for notification type)
在前端通知的开头添加了相应的图标和着色,以指示消息是关于成功、失败还是警告。
Corresponding icons and colouring have been added at the beginning of frontend notifications to indicate whether the message is about success, failure or warning.
| < | < | |||||
|---|---|---|---|---|---|---|
| < | ||||||
| < | ||||||
这些更改允许实际消息在白色背景上,从而提高整体可读性。
These changes allow the actual message to be on a white background, improving overall readability.
前端的绿色背景已被移除(Green background removed)
绿色背景现已移除:
Green background has been removed:
- 对于监测中 - > 问题/触发器 以及相应的仪表板小组件中严重性列中已解决的问题的背景。
- for resolved problems in the severity column in Monitoring → Problems/Triggers and the corresponding dashboard widget
| < | |||
|---|---|---|---|
| < | |||
- 对于 监测中 → 自动发现 的已启用的主机。
- for devices that are up in Monitoring → Discovery
Discovery status details
在 监测中 - > 自动发现中的发现状态详细信息现在显示为单元格内的文本,而不是鼠标悬停时可见的弹出窗口。
Discovery status details in Monitoring → Discovery are now displayed as text inside the cell, instead of a pop-up that's visible upon mouse over.
| 在 Zabbix 4.0.0 中 在 | Zabbix 4.0.0 之前 |
 |
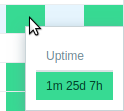 |
此外,在正常运行时间内已从表格中去除绿色背景,而在停机时间内红色背景仍然残留在表格中。
In addition, green colouring is removed from cells with uptime, while red remains in the cells with downtime.
可配置的会话 Cookie 名称(Configurable session cookie name)
在 Zabbix 前端用于内部身份验证的会话 Cookie 名称可以在前端 定义 中的 ZBX_SESSION_NAME 参数进行配置。
The session cookie name that Zabbix frontend uses for internal authentication is now configurable in ZBX_SESSION_NAME of the frontend definitions.
其他的一些更改(Miscellaneous)
- 对于包含 DNS 名称的字段,允许的字符限制已从 63 个 ASCII 字符提高到 255 个 ASCII 字符。 受影响的表单是主机配置和被动代理配置。
- The allowed character limit has been raised from 63 to 255 ASCII characters for fields containing DNS names. The affected forms are host configuration and passive proxy configuration.
- 当导入拓扑图(监测中 → 拓扑图 → 导入 按钮)时,现在默认选中用于导入图片的 创新新的 选项:
- When importing maps (Monitoring → Maps → Import button) the Create new option for importing images is now checked by default:

宏(Macros)
- 现在,触发器配置的 URL 字段已支持 {ITEM.VALUE} 和 {ITEM.LASTVALUE} 宏。
- {ITEM.VALUE}, {ITEM.LASTVALUE} are now supported in the URL field of trigger configuration.
Agent 守护进程(Daemons)
- 现在,proc.num 和 proc.mem 检查在 AIX 平台上支持超过 2KB 的命令行参数。
- Command line arguments that exceed 2KB are now supported in proc.num and proc.mem checks on AIX platform.
性能(Performance)
Zabbix Server 性能的提升(Server performance)
得益于使用 pthread 的互斥锁和读写锁替换信号量,Zabbix server 的性能得到了改进。
Zabbix server performance has been improved by replacing semaphores with pthread mutexes and read-write locks.
问题名称生成(Problem name generation)
之前在前端和 Server 端根据相应的触发器名称生成问题和事件名称,并扩展了所有宏。 这会导致严重的性能问题,如果触发器名称发生更改,那么将无法查看有关问题的历史信息。
Problem and event names previously were generated on the fly in the frontend and on server side based on the respective trigger name with all the macros expanded. That lead to severe performance issues and also made it impossible to see historical information about problems if the trigger name had changed.
现在,在为问题生成事件或恢复已生成事件时,问题和事件名称将直接存储在 problem 和 event 表中。 Zabbix前端可以直接搜索和查询各个表。 此更改可以更好地分离触发器和问题,提高性能,尤其是前端的性能和维护历史问题名称。 但是,数据库中 problem/events 表的大小将变得更大。
Now problem and event names are stored directly in the event and problem tables at the moment when an event is generated for a problem or recovery. Zabbix frontend can search and query the respective tables directly. This change leads to a better separation of triggers and problems, improves performance, especially that of the frontend and maintains historical problem names. However, the size of problem/events tables is now larger.
值得注意的是,对于内部事件,如果名称包含错误消息,那么将说明其错误消息的原因,恢复时将不使用名称。 对于自动发现发现和自动注册事件,不使用任何名称。
Note that for internal events the name contains an error message why an object changed its state; upon recovery no name is used. For discovery and auto-registration events no name is used.
支持新的 {EVENT.NAME} 宏,该宏将返回已解析的 事件/问题 名称。
A new {EVENT.NAME} macro is supported, returning the event/problem name with macros resolved.
关于更多信息,详见:
See also the upgrade notes for:
Logging
- Zabbix Java gateway 日志现在更易于阅读,因为 Java Gateway 的 Warning 和 Error 级别日志将不再提供 Exception stack trace。
- Zabbix Java gateway logs are now easier to read, as exception stack trace is no longer available in error and warning level messages.
API 改进(API improvements)
从现在开始,user.checkAuthentication 方法包含附加参数 "extend"。
From now on user.checkAuthentication method contains additional parameter "extend".
Configurable session cookie name
The session cookie name that Zabbix frontend uses for internal authentication is now configurable in ZBX_SESSION_NAME of the frontend definitions.
Host column always displayed
The host column is now always displayed even if only one host is selected in:
- Monitoring → Latest data
- Monitoring → Web
- Reports → Availability
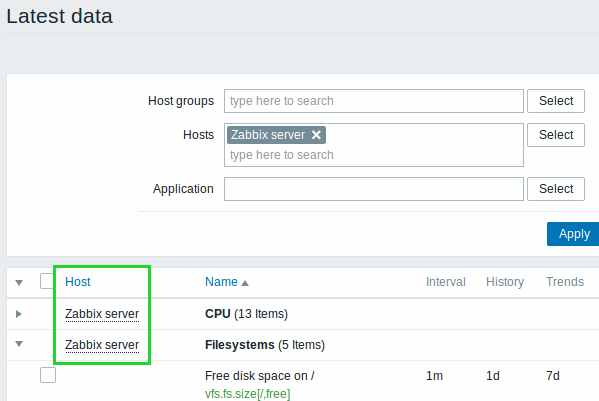
The benefits of this change are:
- The host menu in the latest data page is now always available with links to useful options
- It is clear which host is displayed when using a screenreader
Miscellaneous
- The allowed character limit has been raised from 63 to 255 ASCII characters for fields containing DNS names. The affected forms are host configuration and passive proxy configuration.
- When importing maps (Monitoring → Maps → Import button) the Create new option for importing images is now checked by default:
Macros
- {ITEM.VALUE}, {ITEM.LASTVALUE} are now supported in the URL field of trigger configuration.
Daemons
Validation to avoid proxy/agent data duplication
Session tokens have been added to incoming proxy/agent data along with virtual IDs that are assigned to incoming values. The value ID is a simple ascending counter, unique within one data session (identified by the session token). This ID is used to discard duplicate values that might be sent in poor connectivity environments. For more details on the protocols, see:
Data without session token will be accepted without validation for duplicate values, ensuring backwards compatibility.
Miscellaneous
- Command line arguments that exceed 2KB are now supported in proc.num and proc.mem checks on AIX platform.
Performance
Server performance
Zabbix server performance has been improved by replacing semaphores with pthread mutexes and read-write locks.
Problem name generation
Problem and event names previously were generated on the fly in the frontend and on server side based on the respective trigger name with all the macros expanded. That lead to severe performance issues and also made it impossible to see historical information about problems if the trigger name had changed.
Now problem and event names are stored directly in the 'events' and 'problem' tables at the moment when an event is generated for a problem or recovery. Zabbix frontend can search and query the respective tables directly. This change leads to a better separation of triggers and problems, improves performance, especially that of the frontend and maintains historical problem names. However, the size of problem/events tables is now larger.
Note that for internal events the name contains an error message why an object changed its state; upon recovery no name is used. For discovery and auto-registration events no name is used.
A new {EVENT.NAME} macro is supported, returning the event/problem name with macros resolved.
See also the upgrade notes for:
Logging
- Zabbix Java gateway logs are now easier to read, as exception stack trace is no longer available in error and warning level messages.
API improvements
From now on user.checkAuthentication method contains additional parameter "extend".