
On this page
20 Top hosts
Overview
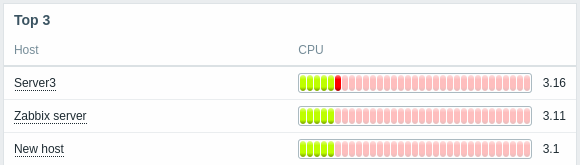
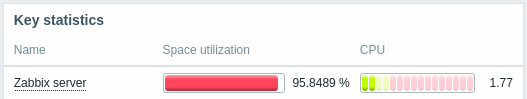
This widget provides a way to create custom tables for displaying the data situation, allowing to display Top N-like reports and progress-bar reports useful for capacity planning.
Configuration
To configure, select Top hosts as type:
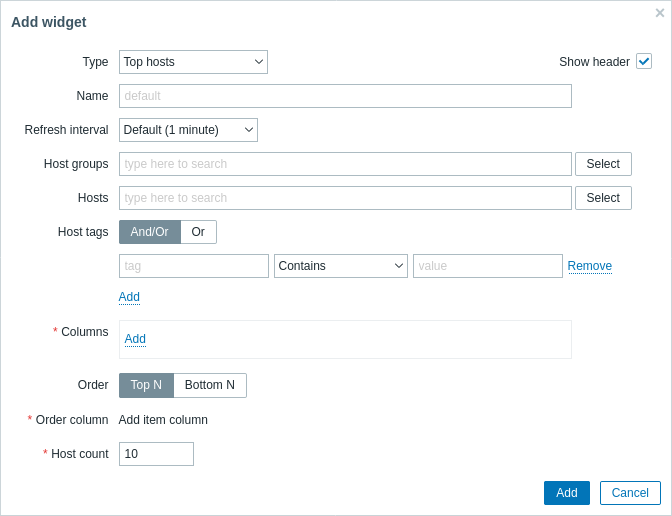
In addition to the parameters that are common for all widgets, you may set the following specific options:
| Host groups | Host groups to display data for. |
| Hosts | Hosts to display data for. |
| Host tags | Specify tags to limit the number of hosts displayed in the widget. It is possible to include as well as exclude specific tags and tag values. Several conditions can be set. Tag name matching is always case-sensitive. There are several operators available for each condition: Exists - include the specified tag names Equals - include the specified tag names and values (case-sensitive) Contains - include the specified tag names where the tag values contain the entered string (substring match, case-insensitive) Does not exist - exclude the specified tag names Does not equal - exclude the specified tag names and values (case-sensitive) Does not contain - exclude the specified tag names where the tag values contain the entered string (substring match, case-insensitive) There are two calculation types for conditions: And/Or - all conditions must be met, conditions having the same tag name will be grouped by the Or condition Or - enough if one condition is met |
| Columns | Add data columns to display. The column order determines their display from left to right. Columns can be reordered by dragging up and down by the handle before the column name. |
| Order | Specify the ordering of rows: Top N - in descending order by the Order column aggregated value Bottom N - in ascending order by the Order column aggregated value |
| Order column | Specify the column from the defined Columns list to use for Top N or Bottom N ordering. |
| Host count | Count of host rows to be shown. |
Column configuration
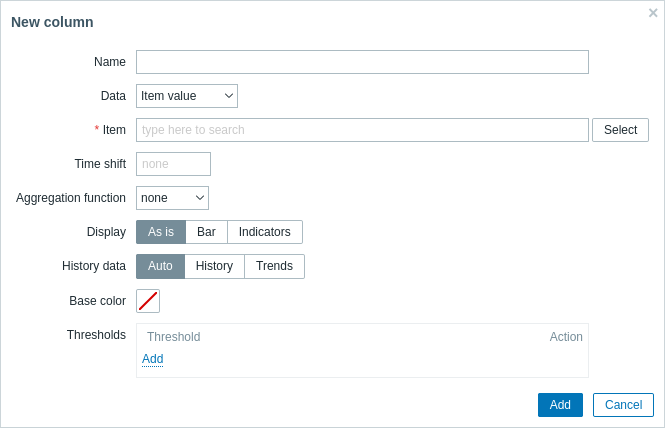
Common column parameters:
| Name | Name of the column. |
| Data | Data type to display in the column: Item value - value of the specified item Host name - host name of the item specified in the Item value column Text - static text string |
| Base color | Background color of the column; fill color if Item value data is displayed as bar/indicators. For Item value data the default color can be overridden by custom color, if the item value is over one of the specified "Thresholds". |
Specific parameters for item value columns:
| Item | Select the item. |
| Time shift | Specify time shift if required. You may use time suffixes in this field. Negative values are allowed. |
| Aggregation function | Specify which aggregation function to use: min - display the smallest value max - display the largest value avg - display the average value sum - display the sum of values count - display the count of values first - display the first value last - display the last value none - display all values (no aggregation) Aggregation allows to display an aggregated value for the chosen interval (5 minutes, an hour, a day), instead of all values. |
| Aggregation interval | Specify the interval for aggregating values. You may use time suffixes in this field. A numeric value without a suffix will be regarded as seconds. This field will not be displayed if Aggregation function is "none". |
| Display | Define how the value should be displayed: As is - as regular text Bar - as solid, color-filled bar Indicators - as segmented, color-filled bar |
| Min | Minimum value for bar/indicators. |
| Max | Maximum value for bar/indicators. |
| Thresholds | Specify threshold values when the background/fill color should change. The list will be sorted in ascending order when saved. |
Specific parameters for text columns:
| Text | Enter the string to display. May contain host and inventory macros. |