
4 Latest data
Overview
In this section you can view the latest values gathered by items.
Graphs are also available for the item values.
This section contains:
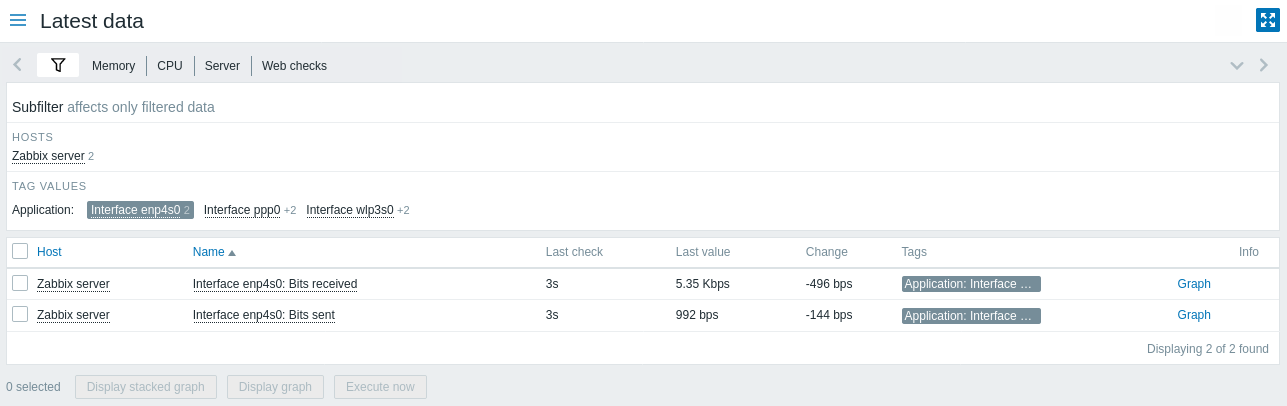
Items are displayed with their name, time since the last check, last value, change amount, tags, and a link to a simple graph/history of item values.
Clicking on the item name opens the item menu with links to available graphs and the item configuration.
Tags in the item list are clickable. If you click on a tag, this tag becomes enabled in the subfilter. The item list now displays the items corresponding to this tag and any other previously selected tags in the subfilter. Note that once the items have been filtered in this way, tags in the list are no longer clickable. Further modification based on tags (e.g. remove, add another filter) must be done in the subfilter.
Values in the Last value column are displayed with unit conversion and value mapping applied. To view raw data, hover over the value.
If an item has errors, for example, has become unsupported, an information icon will
be displayed in the Info column ![]() .
Hover over the icon for details.
.
Hover over the icon for details.
An icon with a question mark
![]() is displayed next to the item name for all items that have a
description. Hover over this icon to see a tooltip with the item
description.
is displayed next to the item name for all items that have a
description. Hover over this icon to see a tooltip with the item
description.
The names of disabled hosts are displayed in red. Data of disabled hosts, including graphs and item value lists, is also accessible in Latest data.
By default, only values that fall within the last 24 hours are displayed. This limit has been introduced with the aim of improving initial loading times for large pages of the latest data. This time period can be extended by changing the value of the Max history display period parameter in Administration → [General](/manual/web_interface/frontend_sections/administration/general#gui).
For items with an update frequency of 1 day or more the change amount will never be displayed (with the default setting). Also in this case the last value will not be displayed at all if it was received more than 24 hours ago.
Buttons
View mode buttons being common for all sections are described on the Monitoring page.
Using filter
You can use the filter to display only the items you are interested in. For better search performance, data is searched with macros unresolved.
The filter icon ![]() is located above the table and the subfilter. Click on it
to expand the filter.
is located above the table and the subfilter. Click on it
to expand the filter.
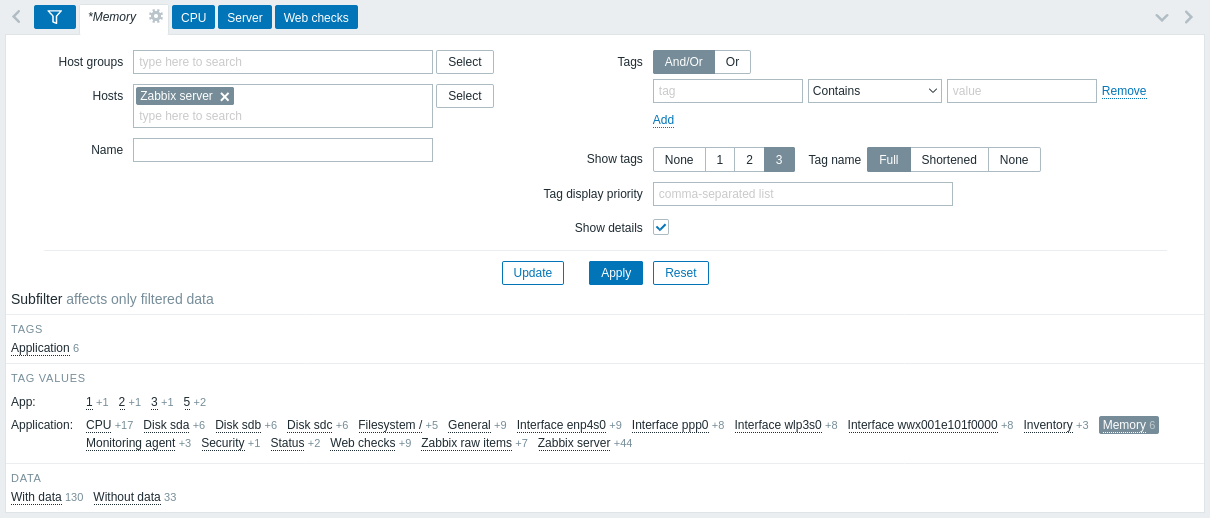
The filter allows to narrow the list by host group, host, item name, tag and other settings. Specifying a parent host group in the filter implicitly selects all nested host groups. See Monitoring -> Problems for details on filtering by tags.
Show details allows to extend the information displayed for the items. Such details as the refresh interval, history and trends settings, item type, and item errors (fine/unsupported) are displayed.
Saving filter
Filter settings can be saved for quick access later. To save a filter, click on the Save as button and enter the filter name and the option to display or hide the number of records in the saved filter. When saved, the filter is created as a named filter tab and immediately activated.
The left/right buttons above the filter may be used to navigate between saved filters. Alternatively, the downward pointing button opens a dropdown menu with all saved filters and you can click on the one you need.
If the settings of a saved filter have been changed, an asterisk is displayed before the filter name in italic. To update the filter according to the new settings, click on the Update button, which is displayed instead of the Save as button.
The Reset button allows to inactivate unsaved filter settings in the main filter and the subfilter.
Using subfilter
The subfilter is useful for a quick one-click access to groups of related items. The subfilter operates autonomously from the main filter - results are filtered immediately, no need to click on Apply in the main filter.
Note that the subfilter only allows to further modify the filtering from the main filter.
Unlike the main filter, the subfilter is updated together with each table refresh request to always get up-to-date information of available filtering options and their counter numbers.
The subfilter shows clickable links allowing to filter items based on a common entity - the host, tag name or tag value. As soon as the entity is clicked, items are immediately filtered; the selected entity is highlighted with gray background. To remove the filtering, click on the entity again. To add another entity to the filtered results, click on another entity.
The number of entities displayed is limited to 100 horizontally. If there are more, a three-dot icon is displayed at the end; it is not clickable. Vertical lists (such as tags with their values) are limited to 20 entries. If there are more, a three-dot icon is displayed; it is not clickable.
The host options in the subfilter are available only if no hosts or more than one host is selected in the main filter.
By default, items with and without data are displayed in the item list. If only one host is selected in the main filter, the subfilter offers the option to filter only items with data, only without data, or both for this host.
A number next to each clickable entity indicates the number of items it has in the results of the main filter. Entities without items are not displayed, unless they were selected in the subfilter before.
Once one entity is selected, the numbers with other available entities are displayed with a plus sign indicating how many items may be added to the current selection.
Graphs
Ad-hoc graphs for comparing items
You may use the checkbox in the first column to select several items and then compare their data in a simple or stacked ad-hoc graph. To do that, select items of interest, then click on the required graph button below the table.
Links to value history/simple graph
The last column in the latest value list offers:
-
a History link (for all textual items) - leading to listings (Values/500 latest values) displaying the history of previous item values.
-
a Graph link (for all numeric items) - leading to a simple graph. However, once the graph is displayed, a dropdown on the upper right offers a possibility to switch to Values/500 latest values as well.
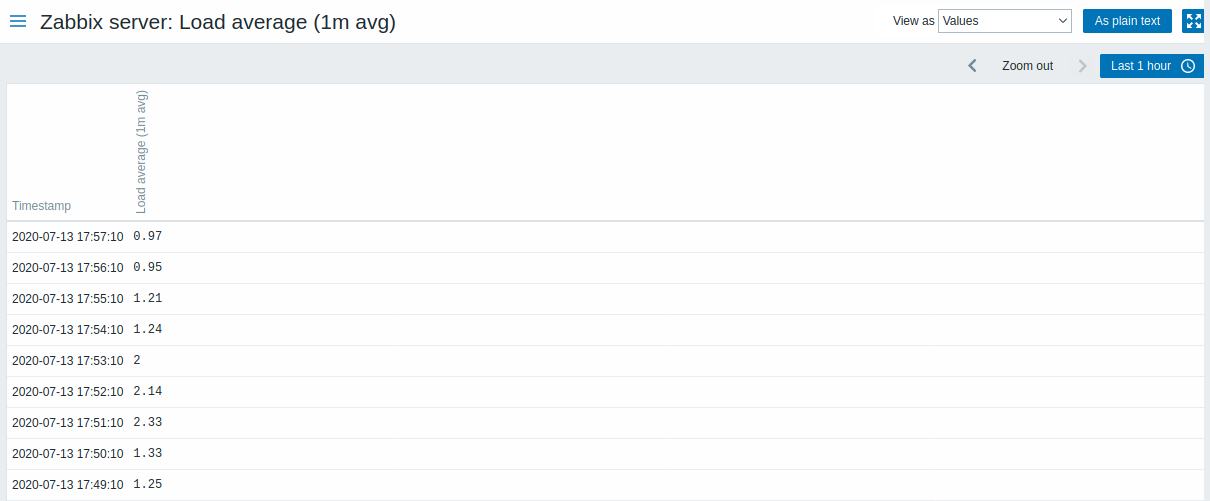
The values displayed in this list are "raw", that is, no postprocessing is applied.
The total amount of values displayed is defined by the value of Limit for search and filter results parameter, set in Administration → General.