
Créer un widget (tutoriel)
Il s'agit d'un didacticiel étape par étape qui montre comment créer un simple widget de tableau de bord. Vous pouvez télécharger tous les fichiers de ce widget sous forme d'archive ZIP : lesson_gauge_chart.zip.
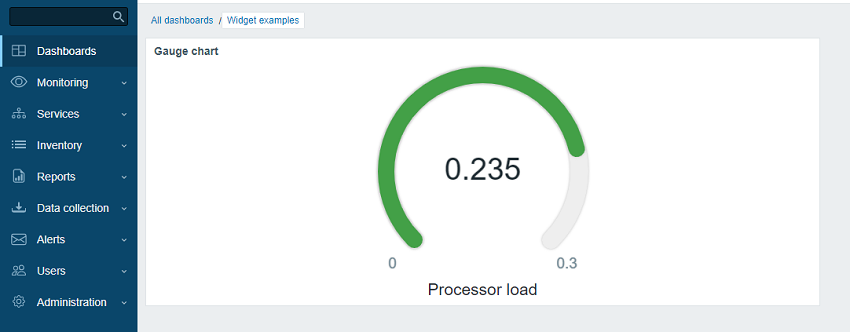
Ce que vous allez créer
Au cours de ce tutoriel, vous allez d'abord créer un widget de base « Hello, world! », puis le convertir en un widget plus avancé qui affiche la valeur d'un élément sous forme de jauge. Voici à quoi ressemblera le widget final :
Partie I - "Hello, world!"
Dans cette section, vous apprendrez comment créer les éléments de widget minimum requis et ajouter un nouveau widget à l'interface Zabbix.
Ajouter un widget vide à l'interface Zabbix
- Créez un répertoire lesson_gauge_chart dans le répertoire modules de votre installation de l'interface Zabbix (par exemple, zabbix/ui/modules).
Tous les widgets personnalisés sont traités comme des modules externes et doivent être ajoutés au répertoire modules de votre installation de l'interface Zabbix (par exemple, zabbix/ui/modules). Le répertoire zabbix/ui/widgets est réservé aux widgets intégrés de Zabbix et est mis à jour en même temps que l'interface Zabbix.
- Créez un fichier manifest.json avec les métadonnées de base du widget (voir la description des paramètres pris en charge).
ui/modules/lesson_gauge_chart/manifest.json
{
    "manifest_version": 2.0,
    "id": "lesson_gauge_chart",
    "type": "widget",
    "name": "Gauge chart",
    "namespace": "LessonGaugeChart",
    "version": "1.1",
    "author": "Zabbix"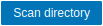
}- Dans l'interface Zabbix, accédez à la section Administration → Général → Modules et cliquez sur le bouton Scan directory.
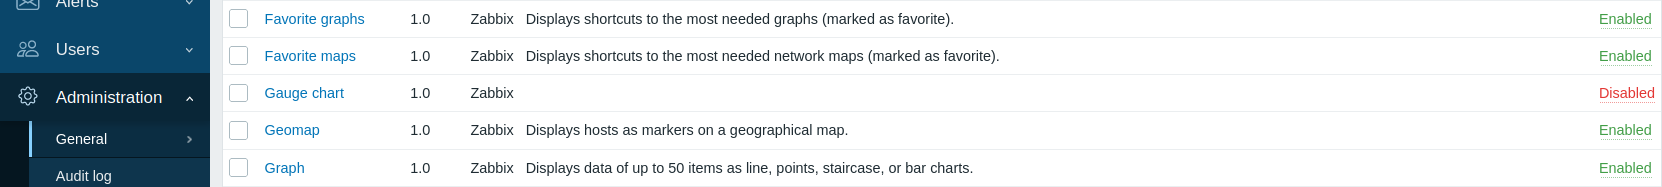
- Repérez le nouveau module Gauge chart dans la liste et cliquez sur le lien hypertexte "Disabled" pour modifier l'état du module de "Disabled" à "Enabled" (si le module n'apparaît pas dans la liste, consultez la section dépannage).
- Ouvrez un tableau de bord, passez-le en mode édition et ajoutez un nouveau widget. Dans le champ Type, sélectionnez "Gauge chart".
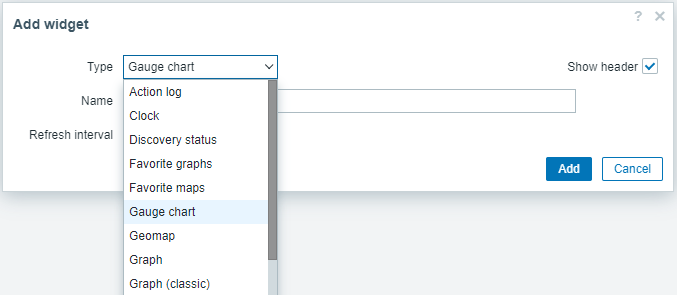
- À ce stade, la configuration du widget Gauge chart ne contient que les champs communs du widget Name et Refresh interval. Cliquez sur Add pour ajouter le widget au tableau de bord.
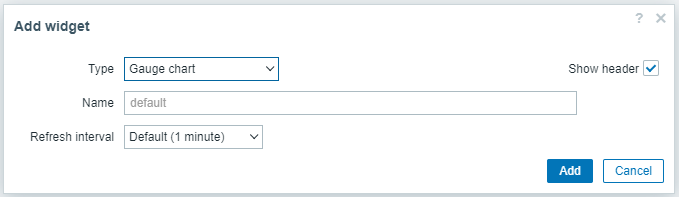
- Un widget vide devrait apparaître sur le tableau de bord. Cliquez sur Save changes dans le coin supérieur droit pour enregistrer le tableau de bord.
![]()
Ajouter une vue de widget
Le fichier de vue du widget doit être situé dans le répertoire views (pour ce tutoriel, ui/modules/lesson_gauge_chart/views/). Si le fichier porte le nom par défaut widget.view.php, vous n’avez pas besoin de l’enregistrer dans le fichier manifest.json. Si le fichier porte un nom différent, indiquez-le dans la section actions/widget.lesson_gauge_chart.view du fichier manifest.json.
-
Créez un répertoire views dans le répertoire lesson_gauge_chart.
-
Créez un fichier widget.view.php dans le répertoire views.
ui/modules/lesson_gauge_chart/views/widget.view.php
<?php

/**
 * Gauge chart widget view.
 *
 * @var CView $this
 * @var array $data
 */

(new CWidgetView($data))
    ->addItem(
        new CTag('h1', true, 'Hello, world!')
    )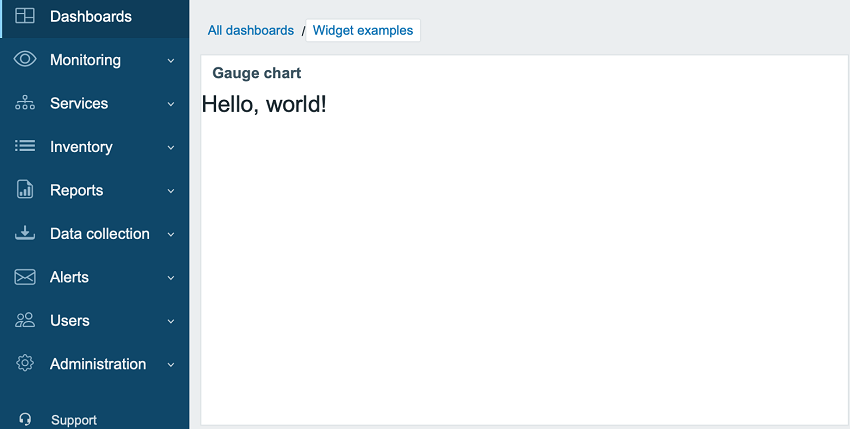
->show();- Actualisez le tableau de bord. Le widget Gauge chart affiche maintenant « Hello, world! ».
Partie II - Tableau des jauges
Ajouter des paramètres à une vue de configuration et les utiliser dans une vue de widget
Dans cette section, vous apprendrez à ajouter un champ de configuration de widget et à afficher la valeur saisie dans la vue du widget sous forme de texte.
La configuration du widget se compose d'un formulaire (Zabbix\Widgets\CWidgetForm) et d'une vue du formulaire du widget (widget.edit.php). Pour ajouter des champs (Zabbix\Widgets\CWidgetField), vous devez créer une classe WidgetForm, qui héritera de Zabbix\Widgets\CWidgetForm.
Le formulaire contient un ensemble de champs (Zabbix\Widgets\CWidgetField) de différents types, utilisés pour valider les valeurs saisies par l'utilisateur. Le champ de formulaire (Zabbix\Widgets\CWidgetField) de chaque type d'élément d'entrée convertit la valeur dans un format unique afin de la stocker dans la base de données.
Le fichier formulaire du widget doit se trouver dans le répertoire includes (pour ce tutoriel, ui/modules/lesson_gauge_chart/includes/). Si le fichier porte le nom par défaut WidgetForm.php, vous n'avez pas besoin de l'enregistrer dans le fichier manifest.json. Si le fichier porte un autre nom, indiquez-le dans la section widget/form_class du fichier manifest.json.
-
Créez un nouveau répertoire includes dans le répertoire lesson_gauge_chart.
-
Créez un fichier WidgetForm.php dans le répertoire includes.
ui/modules/lesson_gauge_chart/includes/WidgetForm.php
<?php

namespace Modules\LessonGaugeChart\Includes;

use Zabbix\Widgets\CWidgetForm;

class WidgetForm extends CWidgetForm {
}- Ajoutez un champ Description au formulaire de configuration du widget. Il s'agit d'un champ texte standard, dans lequel l'utilisateur peut saisir n'importe quel jeu de caractères. Vous pouvez utiliser la classe CWidgetFieldTextBox pour cela.
ui/modules/lesson_gauge_chart/includes/WidgetForm.php
<?php

namespace Modules\LessonGaugeChart\Includes;

use Zabbix\Widgets\CWidgetForm;

use Zabbix\Widgets\Fields\CWidgetFieldTextBox;

class WidgetForm extends CWidgetForm {

    public function addFields(): self {
        return $this
            ->addField(
               new CWidgetFieldTextBox('description', _('Description'))
            );
   }
}- Dans le répertoire views, créez un fichier de vue de configuration du widget widget.edit.php et ajoutez une vue pour le nouveau champ Description. Pour la classe de champ CWidgetFieldTextBox, la vue est CWidgetFieldTextBoxView.
ui/modules/lesson_gauge_chart/views/widget.edit.php
<?php

/**
 * Vue du formulaire du widget Gauge chart.
 *
 * @var CView $this
 * @var array $data
 */

(new CWidgetFormView($data))
    ->addField(
        new CWidgetFieldTextBoxView($data['fields']['description'])
    )
->show();-
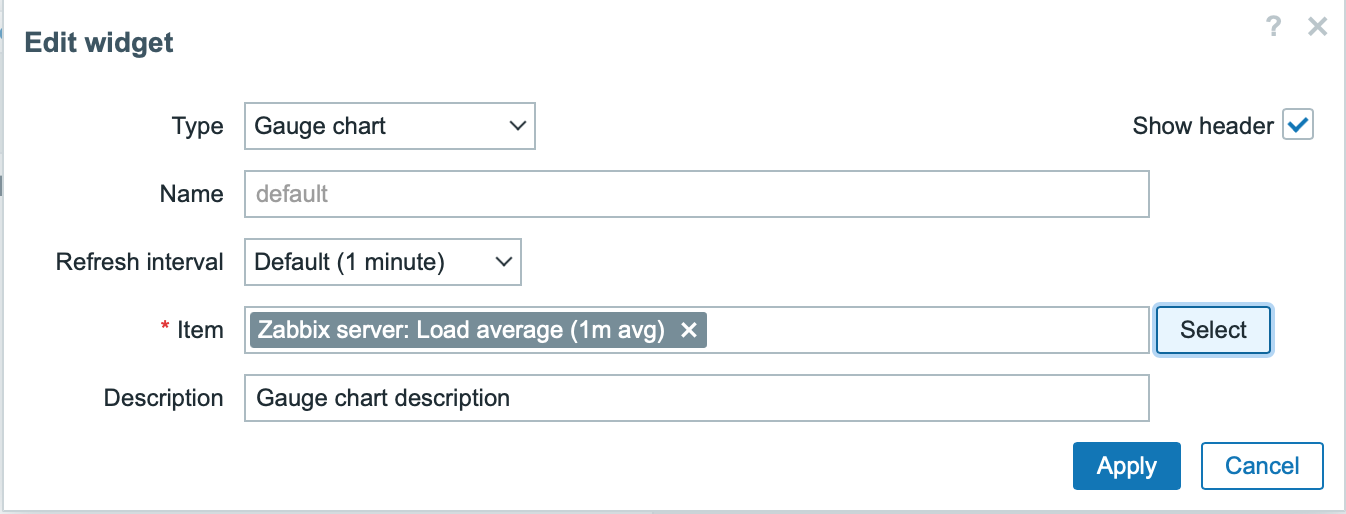
Accédez au tableau de bord et cliquez sur l'icône en forme d'engrenage dans le widget pour ouvrir le formulaire de configuration du widget.
-
Le formulaire de configuration du widget contient désormais un nouveau champ texte Description. Saisissez une valeur, par exemple Gauge chart description.
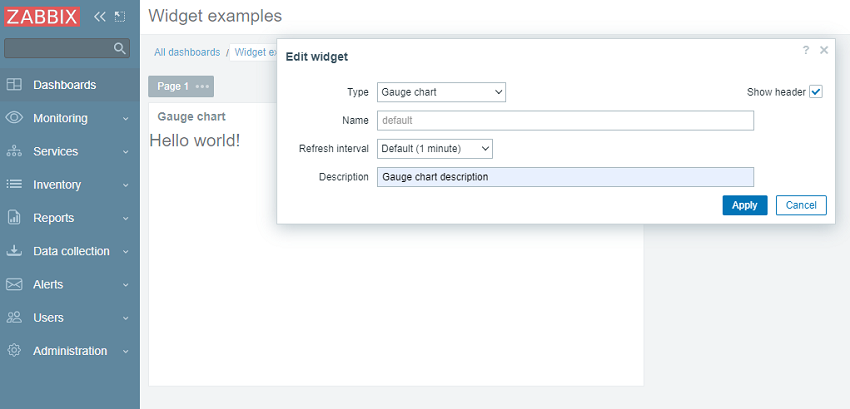
- Cliquez sur Apply dans le formulaire de configuration du widget. Cliquez ensuite sur Save changes dans le coin supérieur droit pour enregistrer le tableau de bord. Notez que la nouvelle description n'est visible nulle part, et que le widget affiche toujours "Hello, world!".
Pour que la nouvelle description apparaisse dans le widget, la valeur du champ Description doit être récupérée depuis la base de données et transmise à la vue du widget. Pour cela, vous devez créer une classe d'action.
-
Créez un nouveau répertoire actions dans le répertoire lesson_gauge_chart.
-
Créez un fichier WidgetView.php dans le répertoire actions. La classe d'action WidgetView héritera de la classe CControllerDashboardWidgetView.
Les valeurs des champs de configuration du widget sont stockées dans la propriété $fields_values de la classe d'action.
ui/modules/lesson_gauge_chart/actions/WidgetView.php
<?php

namespace Modules\LessonGaugeChart\Actions;

use CControllerDashboardWidgetView,
    CControllerResponseData;

class WidgetView extends CControllerDashboardWidgetView {

    protected function doAction(): void {
        $this->setResponse(new CControllerResponseData([
            'name' => $this->getInput('name', $this->widget->getName()),
            'description' => $this->fields_values['description'],
            'user' => [
                'debug_mode' => $this->getDebugMode()
            ]
        ]));
    }
}- Ouvrez manifest.json et enregistrez WidgetView comme classe d'action dans la section actions/widget.lesson_gauge_chart.view.
ui/modules/lesson_gauge_chart/manifest.json
{
    "manifest_version": 2.0,
    "id": "lesson_gauge_chart",
    "type": "widget",
    "name": "Gauge chart",
    "namespace": "LessonGaugeChart",
    "version": "1.0",
    "author": "Zabbix",
    "actions": {
        "widget.lesson_gauge_chart.view": {
            "class": "WidgetView"
        }
    }
}- Vous pouvez maintenant utiliser la valeur du champ de description, contenue dans $data['description'], dans la vue du widget. Ouvrez views/widget.view.php et remplacez le texte statique "Hello, world!" par $data['description'].
ui/modules/lesson_gauge_chart/views/widget.view.php
<?php
/**
* Vue du widget Gauge chart.
*
* @var CView $this
* @var array $data
*/
(new CWidgetView($data))
->addItem(
new CTag('h1', true, $data['description'])
)
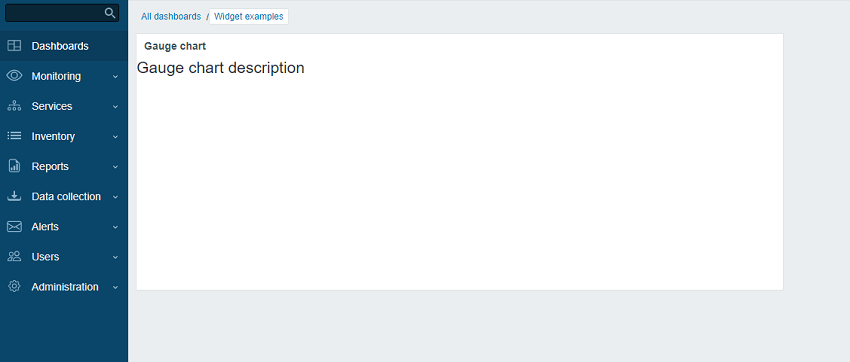
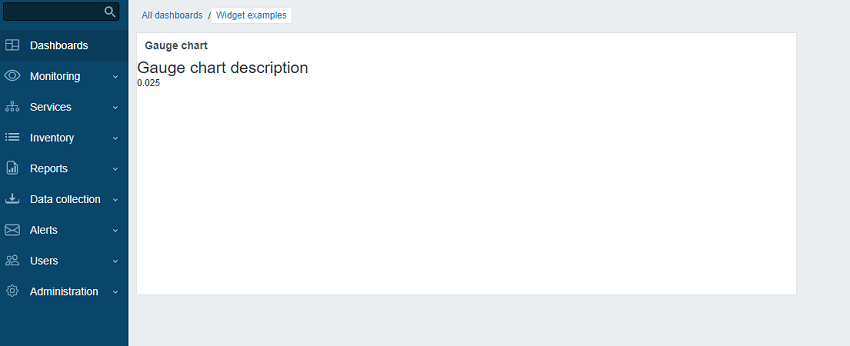
->show();- Actualisez la page du tableau de bord. Vous devriez maintenant voir le texte de description du widget à la place de "Hello, world!".
Récupérer la valeur d'un élément via l'API
Le widget doit afficher la dernière valeur d'un élément choisi par l'utilisateur. Pour cela, vous devez ajouter la possibilité de sélectionner des éléments dans la configuration du widget.
Dans cette section, vous apprendrez à ajouter un champ de sélection d'élément au formulaire du widget et à ajouter la partie visuelle de ce champ à la vue de configuration. Ensuite, le contrôleur du widget pourra récupérer les données de l'élément et sa valeur via une requête API. Une fois reçue, la valeur pourra être affichée dans la vue du widget.
- Ouvrez includes/WidgetForm.php et ajoutez le champ CWidgetFieldMultiSelectItem. Cela permettra de sélectionner un élément dans le formulaire de configuration.
ui/modules/lesson_gauge_chart/includes/WidgetForm.php
<?php

namespace Modules\LessonGaugeChart\Includes;

use Zabbix\Widgets\{
    CWidgetField,
    CWidgetForm
};

use Zabbix\Widgets\Fields\{
    CWidgetFieldMultiSelectItem,
    CWidgetFieldTextBox
};

/**
 * Gauge chart widget form.
 */
class WidgetForm extends CWidgetForm {

    public function addFields(): self {
        return $this
            ->addField(
                (new CWidgetFieldMultiSelectItem('itemid', _('Item')))
                    ->setFlags(CWidgetField::FLAG_NOT_EMPTY | CWidgetField::FLAG_LABEL_ASTERISK)
                    ->setMultiple(false)
            )
            ->addField(
                new CWidgetFieldTextBox('description', _('Description'))
            );
    }
}- Ouvrez views/widget.edit.php et ajoutez le composant visuel du champ à la vue de configuration.
ui/modules/lesson_gauge_chart/views/widget.edit.php
<?php

/**
 * Gauge chart widget form view.
 *
 * @var CView $this
 * @var array $data
 */

(new CWidgetFormView($data))
    ->addField(
        new CWidgetFieldMultiSelectItemView($data['fields']['itemid'])
    )
    ->addField(
        new CWidgetFieldTextBoxView($data['fields']['description'])
    )
->show();-
Revenez au tableau de bord et cliquez sur l'icône en forme d'engrenage dans le widget pour ouvrir le formulaire de configuration du widget.
-
Le formulaire de configuration du widget contient maintenant un nouveau champ de saisie Item. Sélectionnez l'hôte "Zabbix server" et l'élément "Load average (1m avg)".
-
Cliquez sur Apply dans le formulaire de configuration du widget. Puis cliquez sur Save changes dans le coin supérieur droit pour enregistrer le tableau de bord.
-
Ouvrez et modifiez actions/WidgetView.php.
Désormais, l'ID de l'élément sera disponible dans le contrôleur du widget dans $this->fields_values['itemid']. La méthode du contrôleur doAction() collecte les données de l'élément (nom, type de valeur, unités) à l'aide de la méthode API item.get et la dernière valeur de l'élément à l'aide de la méthode API history.get.
ui/modules/lesson_gauge_chart/actions/WidgetView.php
<?php

namespace Modules\LessonGaugeChart\Actions;

use API,
    CControllerDashboardWidgetView,
    CControllerResponseData;

class WidgetView extends CControllerDashboardWidgetView {

    protected function doAction(): void {
        $db_items = API::Item()->get([
            'output' => ['itemid', 'value_type', 'name', 'units'],
            'itemids' => $this->fields_values['itemid'],
            'webitems' => true,
            'filter' => [
                'value_type' => [ITEM_VALUE_TYPE_UINT64, ITEM_VALUE_TYPE_FLOAT]
            ]
        ]);

        $value = null;

        if ($db_items) {
            $item = $db_items[0];

            $history = API::History()->get([
                'output' => API_OUTPUT_EXTEND,
                'itemids' => $item['itemid'],
                'history' => $item['value_type'],
                'sortfield' => 'clock',
                'sortorder' => ZBX_SORT_DOWN,
                'limit' => 1
            ]);

            if ($history) {
                $value = convertUnitsRaw([
                    'value' => $history[0]['value'],
                    'units' => $item['units']
                ]);
            }
        }

        $this->setResponse(new CControllerResponseData([
            'name' => $this->getInput('name', $this->widget->getName()),
            'value' => $value,
            'description' => $this->fields_values['description'],
            'user' => [
                'debug_mode' => $this->getDebugMode()
            ]
        ]));
    }
}- Ouvrez views/widget.view.php et ajoutez la valeur de l'élément à la vue du widget.
ui/modules/lesson_gauge_chart/views/widget.view.php
<?php

/**
 * Gauge chart widget view.
 *
 * @var CView $this
 * @var array $data
 */

(new CWidgetView($data))
    ->addItem([
        new CTag('h1', true, $data['description']),
        new CDiv($data['value'] !== null ? $data['value']['value'] : _('No data'))
    ])
->show();- Actualisez la page du tableau de bord. Le widget affichera la dernière valeur de l'élément.
Ajouter des paramètres de configuration avancés à une vue de configuration
Dans cette section, vous apprendrez à ajouter une section Configuration avancée extensible/réductible avec des paramètres facultatifs, tels que la couleur, les valeurs minimale et maximale, les unités et le champ Description créé précédemment.
- Créez un fichier Widget.php dans le répertoire principal du widget lesson_gauge_chart afin de créer une nouvelle classe Widget.
La classe Widget étendra la classe de base CWidget pour ajouter ou remplacer les paramètres par défaut du widget (dans ce cas, les traductions). Le JavaScript, fourni ci-dessous, affiche la chaîne "No data" en cas de données manquantes. La chaîne "No data" est présente dans les fichiers de traduction de l'interface utilisateur de Zabbix.
S'il existe des constantes de widget, il est recommandé de les spécifier également dans la classe Widget.
ui/modules/lesson_gauge_chart/Widget.php
<?php

namespace Modules\LessonGaugeChart;

use Zabbix\Core\CWidget;

class Widget extends CWidget {

    public const UNIT_AUTO = 0;
    public const UNIT_STATIC = 1;

    public function getTranslationStrings(): array {
        return [
            'class.widget.js' => [
                'No data' => _('No data')
            ]
        ];
    }
}- Ouvrez includes/WidgetForm.php et ajoutez les nouveaux champs Color (sélecteur de couleur), Min (champ numérique), Max (champ numérique) et Units (sélecteur), puis définissez la palette de couleurs par défaut pour le sélecteur de couleur, afin qu'elle puisse être utilisée dans les étapes suivantes.
ui/modules/lesson_gauge_chart/includes/WidgetForm.php
<?php

namespace Modules\LessonGaugeChart\Includes;

use Modules\LessonGaugeChart\Widget;

use Zabbix\Widgets\{
    CWidgetField,
    CWidgetForm
};

use Zabbix\Widgets\Fields\{
    CWidgetFieldColor,
    CWidgetFieldMultiSelectItem,
    CWidgetFieldNumericBox,
    CWidgetFieldSelect,
    CWidgetFieldTextBox
};

/**
 * Gauge chart widget form.
 */
class WidgetForm extends CWidgetForm {

    public const DEFAULT_COLOR_PALETTE = [
        'FF465C', 'B0AF07', '0EC9AC', '524BBC', 'ED1248', 'D1E754', '2AB5FF', '385CC7', 'EC1594', 'BAE37D',
        '6AC8FF', 'EE2B29', '3CA20D', '6F4BBC', '00A1FF', 'F3601B', '1CAE59', '45CFDB', '894BBC', '6D6D6D'
    ];

    public function addFields(): self {
        return $this
            ->addField(
                (new CWidgetFieldMultiSelectItem('itemid', _('Item')))
                    ->setFlags(CWidgetField::FLAG_NOT_EMPTY | CWidgetField::FLAG_LABEL_ASTERISK)
                    ->setMultiple(false)
            )
            ->addField(
                (new CWidgetFieldColor('chart_color', _('Color')))->setDefault('FF0000')
            )
            ->addField(
                (new CWidgetFieldNumericBox('value_min', _('Min')))
                    ->setDefault(0)
                    ->setFlags(CWidgetField::FLAG_NOT_EMPTY | CWidgetField::FLAG_LABEL_ASTERISK)
            )
            ->addField(
                (new CWidgetFieldNumericBox('value_max', _('Max')))
                    ->setDefault(100)
                    ->setFlags(CWidgetField::FLAG_NOT_EMPTY | CWidgetField::FLAG_LABEL_ASTERISK)
            )
            ->addField(
                (new CWidgetFieldSelect('value_units', _('Units'), [
                    Widget::UNIT_AUTO => _x('Auto', 'history source selection method'),
                    Widget::UNIT_STATIC => _x('Static', 'history source selection method')
                ]))->setDefault(Widget::UNIT_AUTO)
            )
            ->addField(
                (new CWidgetFieldTextBox('value_static_units'))
            )
            ->addField(
                new CWidgetFieldTextBox('description', _('Description'))
            );
    }
}- Ouvrez views/widget.edit.php et ajoutez les composants visuels des champs à la vue de configuration.
ui/modules/lesson_gauge_chart/views/widget.edit.php
<?php

/**
 * Gauge chart widget form view.
 *
 * @var CView $this
 * @var array $data
 */

$lefty_units = new CWidgetFieldSelectView($data['fields']['value_units']);
$lefty_static_units = (new CWidgetFieldTextBoxView($data['fields']['value_static_units']))
    ->setPlaceholder(_('value'))
    ->setWidth(ZBX_TEXTAREA_TINY_WIDTH);

(new CWidgetFormView($data))
    ->addField(
        (new CWidgetFieldMultiSelectItemView($data['fields']['itemid']))
            ->setPopupParameter('numeric', true)
    )
    ->addFieldset(
        (new CWidgetFormFieldsetCollapsibleView(_('Advanced configuration')))
            ->addField(
                new CWidgetFieldColorView($data['fields']['chart_color'])
            )
            ->addField(
                new CWidgetFieldNumericBoxView($data['fields']['value_min'])
            )
            ->addField(
                new CWidgetFieldNumericBoxView($data['fields']['value_max'])
            )
            ->addItem([
                $lefty_units->getLabel(),
                (new CFormField([
                    $lefty_units->getView()->addClass(ZBX_STYLE_FORM_INPUT_MARGIN),
                    $lefty_static_units->getView()
                ]))
            ])
            ->addField(
                new CWidgetFieldTextBoxView($data['fields']['description'])
            )
    )
    ->show();
La méthode addField() de la classe CWidgetFormView prend une chaîne de classe CSS comme deuxième paramètre.
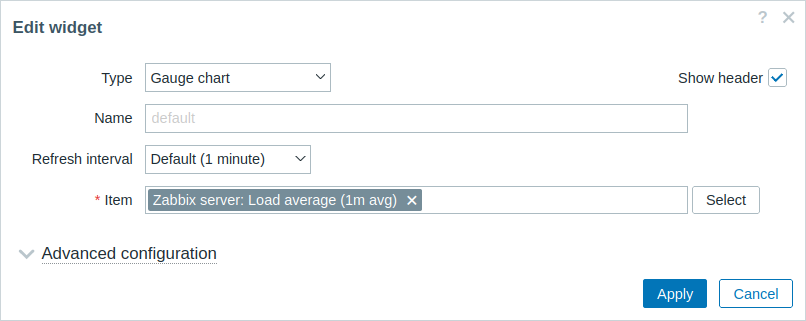
- Revenez au tableau de bord, passez en mode édition et cliquez sur l'icône en forme d'engrenage dans le widget pour ouvrir le formulaire de configuration du widget. Le formulaire de configuration du widget contient désormais une nouvelle section extensible/réductible Configuration avancée.
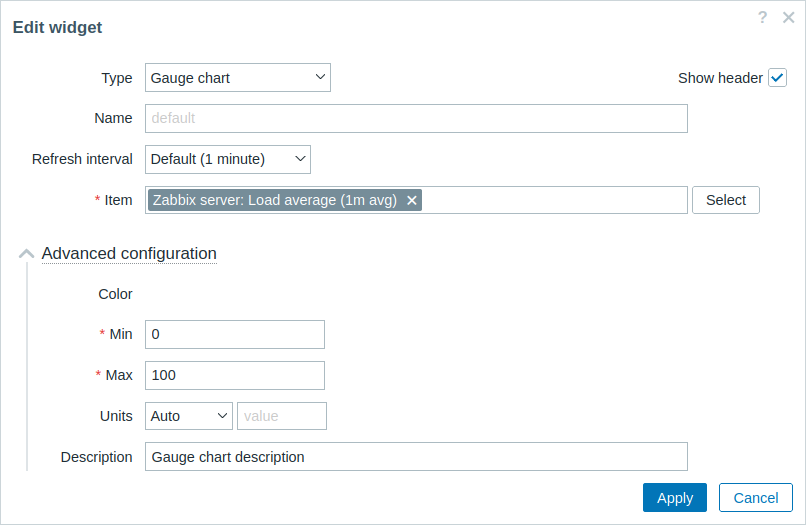
- Développez la section Configuration avancée pour voir les champs de configuration supplémentaires du widget. Notez que le champ Color ne dispose pas encore d'un sélecteur de couleur. Cela est dû au fait que le sélecteur de couleur doit être initialisé avec JavaScript, qui sera ajouté dans la section suivante - Ajouter JavaScript au widget.
Ajouter du JavaScript au widget
Dans cette section, vous apprendrez à ajouter un graphique en jauge - créé à l'aide de JavaScript - qui indique si la dernière valeur est normale ou trop élevée/trop faible.
- Créez un fichier widget.edit.js.php dans le répertoire views.
JavaScript sera chargé d'initialiser le sélecteur de couleur dans la vue de configuration.
ui/modules/lesson_gauge_chart/views/widget.edit.js.php
<?php

use Modules\LessonGaugeChart\Widget;

?>

window.widget_lesson_gauge_chart_form = new class {

    init({color_palette}) {
        this._unit_select = document.getElementById('value_units');
        this._unit_value = document.getElementById('value_static_units');

        this._unit_select.addEventListener('change', () => this.updateForm());

        colorPalette.setThemeColors(color_palette);

        for (const colorpicker of jQuery('.<?= ZBX_STYLE_COLOR_PICKER ?> input')) {
            jQuery(colorpicker).colorpicker();
        }

        const overlay = overlays_stack.getById('widget_properties');

        for (const event of ['overlay.reload', 'overlay.close']) {
            overlay.$dialogue[0].addEventListener(event, () => { jQuery.colorpicker('hide'); });
        }

        this.updateForm();
    }

    updateForm() {
        this._unit_value.disabled = this._unit_select.value == <?= Widget::UNIT_AUTO ?>;
    }
};- Ouvrez views/widget.edit.php et ajoutez le fichier widget.edit.js.php avec le JavaScript à la vue de configuration. Pour cela, utilisez la méthode includeJsFile(). Pour ajouter du JavaScript en ligne, utilisez la méthode addJavaScript().
ui/modules/lesson_gauge_chart/views/widget.edit.php
<?php

/**
 * Vue du formulaire du widget graphique en jauge.
 *
 * @var CView $this
 * @var array $data
 */

use Modules\LessonGaugeChart\Includes\WidgetForm;

$lefty_units = new CWidgetFieldSelectView($data['fields']['value_units']);
$lefty_static_units = (new CWidgetFieldTextBoxView($data['fields']['value_static_units']))
    ->setPlaceholder(_('value'))
    ->setWidth(ZBX_TEXTAREA_TINY_WIDTH);

(new CWidgetFormView($data))
    ->addField(
        (new CWidgetFieldMultiSelectItemView($data['fields']['itemid']))
            ->setPopupParameter('numeric', true)
    )
    ->addFieldset(
        (new CWidgetFormFieldsetCollapsibleView(_('Advanced configuration')))
            ->addField(
                new CWidgetFieldColorView($data['fields']['chart_color'])
            )
            ->addField(
                new CWidgetFieldNumericBoxView($data['fields']['value_min'])
            )
            ->addField(
                new CWidgetFieldNumericBoxView($data['fields']['value_max'])
            )
            ->addItem([
                $lefty_units->getLabel(),
                (new CFormField([
                    $lefty_units->getView()->addClass(ZBX_STYLE_FORM_INPUT_MARGIN),
                    $lefty_static_units->getView()
                ]))
            ])
            ->addField(
                new CWidgetFieldTextBoxView($data['fields']['description'])
            )
    )
    ->includeJsFile('widget.edit.js.php')
    ->addJavaScript('widget_lesson_gauge_chart_form.init('.json_encode([
        'color_palette' => WidgetForm::DEFAULT_COLOR_PALETTE
    ], JSON_THROW_ON_ERROR).');')
->show();- Revenez au tableau de bord, cliquez sur l'icône en forme d'engrenage dans le widget pour ouvrir le formulaire de configuration du widget. Développez ensuite la section Advanced configuration pour voir le sélecteur de couleur initialisé. Renseignez les champs avec des valeurs et sélectionnez une couleur pour le graphique en jauge.
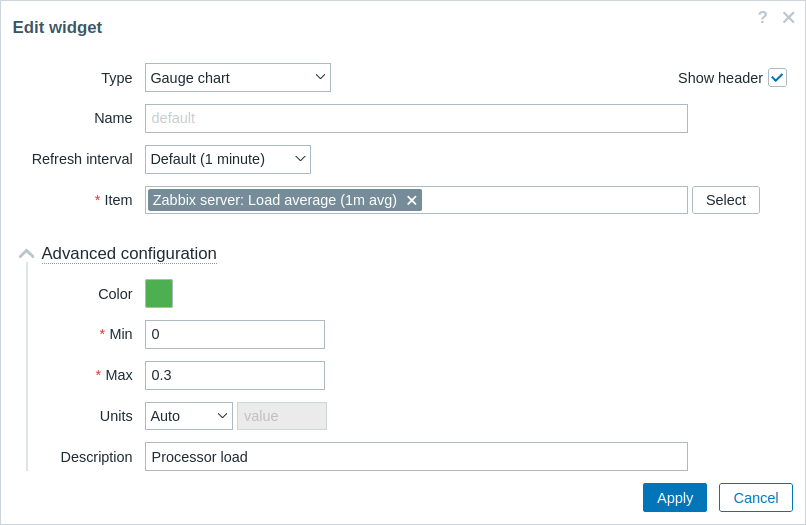
-
Cliquez sur Apply dans le formulaire de configuration du widget. Cliquez ensuite sur Save changes dans le coin supérieur droit pour enregistrer le tableau de bord.
-
Ouvrez actions/WidgetView.php et mettez à jour le contrôleur.
La propriété $this->fields_values contient désormais les valeurs de tous les champs de Advanced configuration. Finalisez le contrôleur pour permettre le passage de la configuration et de la valeur de l'élément sélectionné à la vue du widget.
ui/modules/lesson_gauge_chart/actions/WidgetView.php
<?php

namespace Modules\LessonGaugeChart\Actions;

use API,
    CControllerDashboardWidgetView,
    CControllerResponseData;

class WidgetView extends CControllerDashboardWidgetView {

    protected function doAction(): void {
        $db_items = API::Item()->get([
            'output' => ['itemid', 'value_type', 'name', 'units'],
            'itemids' => $this->fields_values['itemid'],
            'webitems' => true,
            'filter' => [
                'value_type' => [ITEM_VALUE_TYPE_UINT64, ITEM_VALUE_TYPE_FLOAT]
            ]
        ]);

        $history_value = null;

        if ($db_items) {
            $item = $db_items[0];

            $history = API::History()->get([
                'output' => API_OUTPUT_EXTEND,
                'itemids' => $item['itemid'],
                'history' => $item['value_type'],
                'sortfield' => 'clock',
                'sortorder' => ZBX_SORT_DOWN,
                'limit' => 1
            ]);

            if ($history) {
                $history_value = convertUnitsRaw([
                    'value' => $history[0]['value'],
                    'units' => $item['units']
                ]);
            }
        }

        $this->setResponse(new CControllerResponseData([
            'name' => $this->getInput('name', $this->widget->getName()),
            'history' => $history_value,
            'fields_values' => $this->fields_values,
            'user' => [
                'debug_mode' => $this->getDebugMode()
            ]
        ]));
    }
}- Ouvrez et modifiez views/widget.view.php.
Vous devez créer un conteneur pour le graphique en jauge, que vous dessinerez dans les étapes suivantes, ainsi qu'un conteneur pour la description.
Pour transmettre des valeurs à JavaScript sous forme d'objet JSON, utilisez la méthode setVar().
ui/modules/lesson_gauge_chart/views/widget.view.php
<?php

/**
 * Vue du widget graphique en jauge.
 *
 * @var CView $this
 * @var array $data
 */

(new CWidgetView($data))
    ->addItem([
        (new CDiv())->addClass('chart'),
        $data['fields_values']['description']
            ? (new CDiv($data['fields_values']['description']))->addClass('description')
            : null
    ])
    ->setVar('history', $data['history'])
    ->setVar('fields_values', $data['fields_values'])
->show();-
Créez un nouveau répertoire assets dans le répertoire lesson_gauge_chart. Ce répertoire servira à stocker du JavaScript, du CSS et éventuellement d'autres ressources, comme des polices ou des images.
-
Pour le JavaScript de la vue du widget, créez un répertoire js dans le répertoire assets.
-
Créez un fichier class.widget.js dans le répertoire assets/js.
Cette classe JavaScript du widget étendra la classe JavaScript de base de tous les widgets du tableau de bord - CWidget.
Le tableau de bord repose sur une implémentation correcte d'un widget et lui transmet toute information pertinente en appelant les méthodes JavaScript correspondantes. Le tableau de bord attend également du widget qu'il génère des événements lorsqu'une interaction se produit. Ainsi, la classe CWidget contient un ensemble de méthodes avec l'implémentation par défaut du comportement du widget, qui peut être personnalisée en étendant la classe.
Dans ce cas, une certaine personnalisation est nécessaire ; une logique personnalisée sera donc implémentée pour le comportement suivant du widget :
- l'initialisation du widget, qui est responsable de la définition de l'état initial du widget (voir la méthode onInitialize());
- l'affichage du contenu du widget (c'est-à-dire le dessin du graphique en jauge) si le processus de mise à jour du widget s'est déroulé avec succès et sans erreurs (voir la méthode processUpdateResponse(response) et les méthodes associées _resizeChart() et _updatedChart())
- le redimensionnement du widget (voir la méthode onResize() et la méthode associée _resizeChart())
Pour les autres aspects du widget graphique en jauge, l'implémentation par défaut du comportement du widget sera utilisée. Pour en savoir plus sur les méthodes JavaScript de la classe CWidget, consultez : JavaScript.
Comme ce JavaScript est requis pour la vue du widget, il doit être chargé avec la page du tableau de bord. Pour activer le chargement du JavaScript, vous devrez mettre à jour les paramètres assets/js et js_class dans le fichier manifest.json comme indiqué à l'étape 10.
ui/modules/lesson_gauge_chart/assets/js/class.widget.js
class WidgetLessonGaugeChart extends CWidget {

    static UNIT_AUTO = 0;
    static UNIT_STATIC = 1;

    onInitialize() {
        super.onInitialize();

        this._refresh_frame = null;
        this._chart_container = null;
        this._canvas = null;
        this._chart_color = null;
        this._min = null;
        this._max = null;
        this._value = null;
        this._last_value = null;
        this._units = '';
    }

    processUpdateResponse(response) {
        if (response.history === null) {
            this._value = null;
            this._units = '';
        }
        else {
            this._value = Number(response.history.value);
            this._units = response.fields_values.value_units == WidgetLessonGaugeChart.UNIT_AUTO
                ? response.history.units
                : response.fields_values.value_static_units;
        }

        this._chart_color = response.fields_values.chart_color;
        this._min = Number(response.fields_values.value_min);
        this._max = Number(response.fields_values.value_max);

        super.processUpdateResponse(response);
    }

    setContents(response) {
        if (this._canvas === null) {
            super.setContents(response);

            this._chart_container = this._body.querySelector('.chart');
            this._chart_container.style.height =
                `${this._getContentsSize().height - this._body.querySelector('.description').clientHeight}px`;
            this._canvas = document.createElement('canvas');

            this._chart_container.appendChild(this._canvas);

            this._resizeChart();
        }

        this._updatedChart();
    }

    onResize() {
        super.onResize();

        if (this._state === WIDGET_STATE_ACTIVE) {
            this._resizeChart();
        }
    }

    _resizeChart() {
        const ctx = this._canvas.getContext('2d');
        const dpr = window.devicePixelRatio;

        this._canvas.style.display = 'none';
        const size = Math.min(this._chart_container.offsetWidth, this._chart_container.offsetHeight);
        this._canvas.style.display = '';

        this._canvas.width = size * dpr;
        this._canvas.height = size * dpr;

        ctx.scale(dpr, dpr);

        this._canvas.style.width = `${size}px`;
        this._canvas.style.height = `${size}px`;

        this._refresh_frame = null;

        this._updatedChart();
    }

    _updatedChart() {
        if (this._last_value === null) {
            this._last_value = this._min;
        }

        const start_time = Date.now();
        const end_time = start_time + 400;

        const animate = () => {
            const time = Date.now();

            if (time <= end_time) {
                const progress = (time - start_time) / (end_time - start_time);
                const smooth_progress = 0.5 + Math.sin(Math.PI * (progress - 0.5)) / 2;
                let value = this._value !== null ? this._value : this._min;
                value = (this._last_value + (value - this._last_value) * smooth_progress - this._min) / (this._max - this._min);

                const ctx = this._canvas.getContext('2d');
                const size = this._canvas.width;
                const char_weight = size / 12;
                const char_shadow = 3;
                const char_x = size / 2;
                const char_y = size / 2;
                const char_radius = (size - char_weight) / 2 - char_shadow;

                const font_ratio = 32 / 100;

                ctx.clearRect(0, 0, size, size);

                ctx.beginPath();
                ctx.shadowBlur = char_shadow;
                ctx.shadowColor = '#bbb';
                ctx.strokeStyle = '#eee';
                ctx.lineWidth = char_weight;
                ctx.lineCap = 'round';
                ctx.arc(char_x, char_y, char_radius, Math.PI * 0.749, Math.PI * 2.251, false);
                ctx.stroke();

                ctx.beginPath();
                ctx.strokeStyle = `#${this._chart_color}`;
                ctx.lineWidth = char_weight - 2;
                ctx.lineCap = 'round';
                ctx.arc(char_x, char_y, char_radius, Math.PI * 0.75,
                    Math.PI * (0.75 + (1.5 * Math.min(1, Math.max(0, value)))), false
                    );
                ctx.stroke();

                ctx.shadowBlur = 2;
                ctx.fillStyle = '#1f2c33';
                ctx.font = `${(char_radius * font_ratio)|0}px Arial`;
                ctx.textAlign = 'center';
                ctx.textBaseline = 'middle';
                ctx.fillText(`${this._value !== null ? this._value : t('No data')}${this._units}`,
                    char_x, char_y, size - char_shadow * 4 - char_weight * 2
                );

                ctx.fillStyle = '#768d99';
                ctx.font = `${(char_radius * font_ratio * .5)|0}px Arial`;
                ctx.textBaseline = 'top';

                ctx.textAlign = 'left';
                ctx.fillText(`${this._min}${this._min != '' ? this._units : ''}`,
                    char_weight * .75, size - char_weight * 1.25, size / 2 - char_weight
                );

                ctx.textAlign = 'right';
                ctx.fillText(`${this._max}${this._max != '' ? this._units : ''}`,
                    size - char_weight * .75, size - char_weight * 1.25, size / 2 - char_weight
                );

                requestAnimationFrame(animate);
            }
            else {
                this._last_value = this._value;
            }
        };

        requestAnimationFrame(animate);
    }
}- Ouvrez manifest.json et ajoutez :
- le nom du fichier (class.widget.js) au tableau dans la section assets/js ;
- le nom de la classe (WidgetLessonGaugeChart) au paramètre js_class dans la section widget.
La classe WidgetLessonGaugeChart sera désormais chargée automatiquement avec le tableau de bord.
ui/modules/lesson_gauge_chart/manifest.json
{
    "manifest_version": 2.0,
    "id": "lesson_gauge_chart",
    "type": "widget",
    "name": "Gauge chart",
    "namespace": "LessonGaugeChart",
    "version": "1.0",
    "author": "Zabbix",
    "actions": {
        "widget.lesson_gauge_chart.view": {
            "class": "WidgetView"
        }
    },
    "widget": {
        "js_class": "WidgetLessonGaugeChart"
    },
    "assets": {
        "js": ["class.widget.js"]
    }
}
Ajouter des styles CSS au Widget
Dans cette section, vous apprendrez à ajouter des styles CSS personnalisés afin de rendre vos Widgets plus attrayant.
-
Pour les styles de Widgets, créez un nouveau répertoire css dans le répertoire assets.
-
Créez un fichier widget.css dans le répertoire assets/css. Pour styliser les éléments du widget, utilisez le sélecteur div.dashboard-widget-{widget id}. Pour configurer le CSS a l’ensemble du Widget, utilisez le sélecteur form.dashboard-widget-{widget id}
ui/modules/lesson_gauge_chart/assets/css/widget.css
div.dashboard-widget-lesson_gauge_chart {
    display: grid;
    grid-template-rows: 1fr;
    padding: 0;
}

div.dashboard-widget-lesson_gauge_chart .chart {
    display: grid;
    align-items: center;
    justify-items: center;
}

div.dashboard-widget-lesson_gauge_chart .chart canvas {
    background: white;
}

div.dashboard-widget-lesson_gauge_chart .description {
    padding-bottom: 8px;
    font-size: 1.750em;
    line-height: 1.2;
    text-align: center;
}

.dashboard-grid-widget-hidden-header div.dashboard-widget-lesson_gauge_chart .chart {
    margin-top: 8px;
}- Ouvrir manifest.json et ajoutez le nom du fichier CSS (widget.css) au tableau dans la section assets/css. Cela permettra aux styles CSS définis dans widget.css de se charger avec la page du tableau de bord.
ui/modules/lesson_gauge_chart/manifest.json
{
    "manifest_version": 2.0,
    "id": "lesson_gauge_chart",
    "type": "widget",
    "name": "Gauge chart",
    "namespace": "LessonGaugeChart",
    "version": "1.0",
    "author": "Zabbix SIA",
    "actions": {
        "widget.lesson_gauge_chart.view": {
            "class": "WidgetView"
        }
    },
    "widget": {
        "js_class": "WidgetLessonGaugeChart"
    },
    "assets": {
        "css": ["widget.css"],
        "js": ["class.widget.js"]
    }
}- Rafraichir la page du tableau de bord afin de voir la version finale du Widget.