
Create a widget (tutorial)
This is a step-by-step tutorial that shows how to create a simple dashboard widget.
The minimum required Zabbix version for this tutorial is 6.4.4.
You can download all files of this widget as a ZIP archive: lesson_gauge_chart.zip.
What you'll build
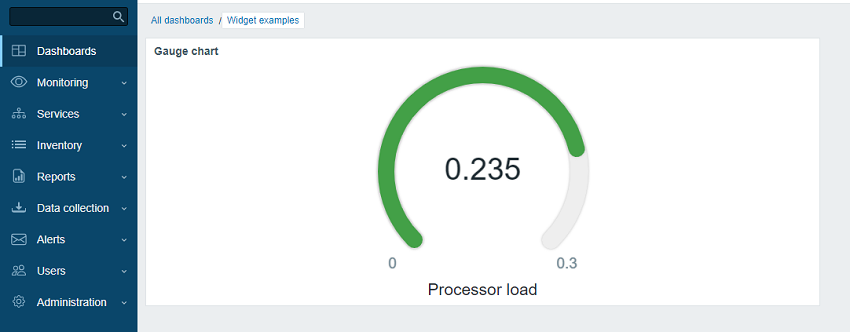
During this tutorial, you will first build a basic "Hello, world!" widget and then convert it into a more advanced widget that displays an item value as a gauge chart. Here's how the finished widget will look like:
Part I - "Hello, world!"
In this section you will learn how to create the minimum required widget elements and add a new widget to Zabbix frontend.
Add a blank widget to Zabbix frontend
- Create a directory lesson_gauge_chart in the modules directory of your Zabbix frontend installation (for example, zabbix/ui/modules).
All custom widgets are treated as external modules and must be added to the modules directory of your Zabbix frontend installation (for example, zabbix/ui/modules). The directory zabbix/ui/widgets is reserved for Zabbix built-in widgets and gets updated along with Zabbix UI.
- Create a manifest.json file with basic widget metadata (see the description of supported parameters).
ui/modules/lesson_gauge_chart/manifest.json
{
    "manifest_version": 2.0,
    "id": "lesson_gauge_chart",
    "type": "widget",
    "name": "Gauge chart",
    "namespace": "LessonGaugeChart",
    "version": "1.0",
    "author": "Zabbix SIA"
}- In Zabbix frontend, go to Administration → General → Modules section and click on the Scan directory button.
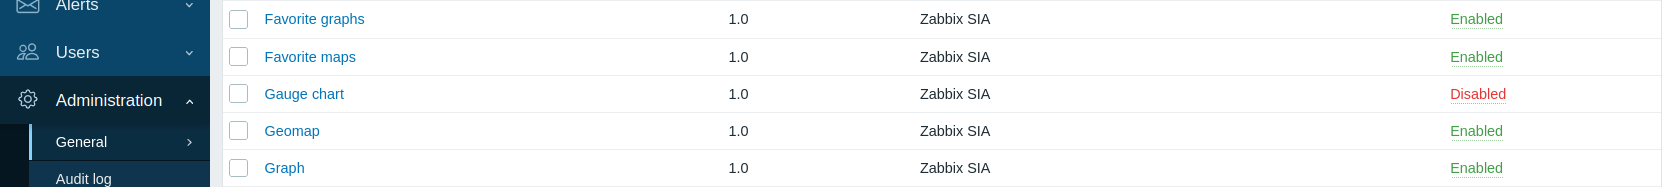
- Locate the new module Gauge chart in the list and click on the "Disabled" hyperlink to change the module's status from "Disabled" to "Enabled".
- Open a dashboard, switch it to the edit mode and add a new widget. In the Type field, select "Gauge chart".
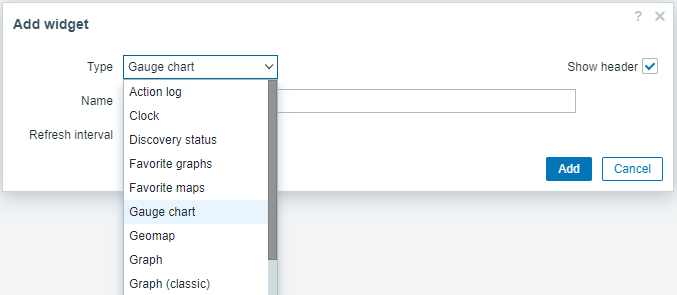
- At this point, the Gauge chart widget configuration contains only common widget fields Name and Refresh interval. Click on Add to add the widget to the dashboard.
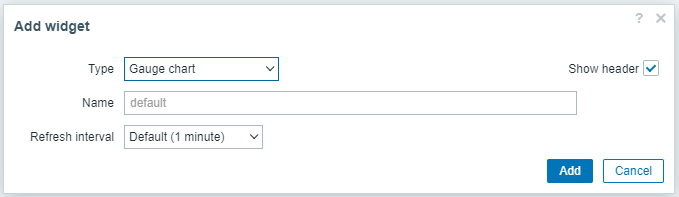
- A blank widget should appear on the dashboard. Click on Save changes in the top right corner to save the dashboard.
![]()
Add a widget view
The widget's view file should be located in the views directory (for this tutorial, ui/modules/lesson_gauge_chart/views/). If the file has the default name widget.view.php, you do not need to register it in the manifest.json file. If the file has a different name, specify it in the actions/widget.lesson_gauge_chart.view section of the manifest.json file.
-
Create a directory views in the lesson_gauge_chart directory.
-
Create a widget.view.php file in the views directory.
ui/modules/lesson_gauge_chart/views/widget.view.php
<?php

/**
 * Gauge chart widget view.
 *
 * @var CView $this
 * @var array $data
 */

(new CWidgetView($data))
    ->addItem(
        new CTag('h1', true, 'Hello, world!')
    )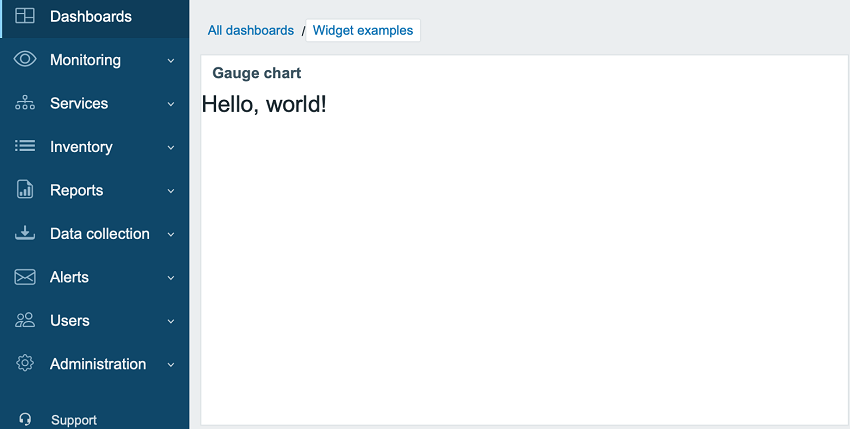
->show();- Refresh the dashboard. The Gauge chart widget now displays "Hello, world!".
Part II - Gauge chart
Add settings to a configuration view and use them in a widget view
In this section, you will learn how to add a widget configuration field and show the entered value in the widget view as text.
The widget configuration consists of a form (Zabbix\Widgets\CWidgetForm) and a widget form view (widget.edit.php). To add fields (Zabbix\Widgets\CWidgetField), you need to create a WidgetForm class, which will extend Zabbix\Widgets\CWidgetForm.
The form contains the set of fields (Zabbix\Widgets\CWidgetField) of various types, which are used to validate user-entered values. The form field (Zabbix\Widgets\CWidgetField) for each input element type converts the value into a single format to store it in the database.
The widget's form file should be located in the includes directory (for this tutorial, ui/modules/lesson_gauge_chart/includes/). If the file has the default name WidgetForm.php, you do not need to register it in the manifest.json file. If the file has a different name, specify it in the widget/form_class section of the manifest.json file.
-
Create a new directory includes in the lesson_gauge_chart directory.
-
Create a WidgetForm.php file in the includes directory.
ui/modules/lesson_gauge_chart/includes/WidgetForm.php
<?php

namespace Modules\LessonGaugeChart\Includes;

use Zabbix\Widgets\CWidgetForm;

class WidgetForm extends CWidgetForm {
}- Add a Description field to widget configuration form. This is a regular text field, where a user can enter any character set. You can use the CWidgetFieldTextBox class for it.
ui/modules/lesson_gauge_chart/includes/WidgetForm.php
<?php

namespace Modules\LessonGaugeChart\Includes;

use Zabbix\Widgets\CWidgetForm;

use Zabbix\Widgets\Fields\CWidgetFieldTextBox;

class WidgetForm extends CWidgetForm {

    public function addFields(): self {
        return $this
            ->addField(
                new CWidgetFieldTextBox('description', _('Description'))
            );
   }
}- In the views directory, create a widget configuration view file widget.edit.php and add a view for the new Description field. For the CWidgetFieldTextBox field class, the view is CWidgetFieldTextBoxView.
ui/modules/lesson_gauge_chart/views/widget.edit.php
<?php

/**
 * Gauge chart widget form view.
 *
 * @var CView $this
 * @var array $data
 */

(new CWidgetFormView($data))
    ->addField(
        new CWidgetFieldTextBoxView($data['fields']['description'])
    )
->show();-
Go to the dashboard and click on the gear icon in the widget to open the widget configuration form.
-
The widget configuration form now contains a new Description text field. Enter any value, for example, Gauge chart description.
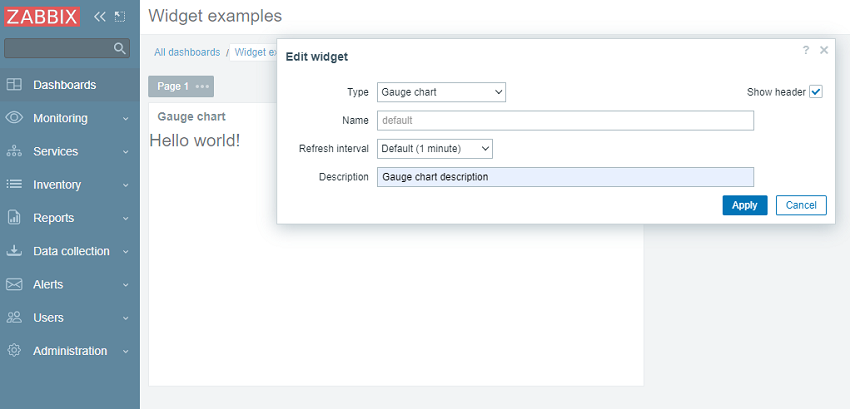
- Click on Apply in the widget configuration form. Then click on Save changes in the top right corner to save the dashboard. Note that the new description is not visible anywhere, and the widget still displays "Hello, world!".
For the new description to appear in the widget, the Description field value needs to be retrieved from the database and passed to the widget view. For that, you need to create an action class.
-
Create a new directory actions in the lesson_gauge_chart directory.
-
Create a WidgetView.php file in the actions directory. The WidgetView action class will extend the CControllerDashboardWidgetView class.
Values of the widget configuration fields are stored in the $fields_values property of the action class.
ui/modules/lesson_gauge_chart/actions/WidgetView.php
<?php

namespace Modules\LessonGaugeChart\Actions;

use CControllerDashboardWidgetView,
    CControllerResponseData;

class WidgetView extends CControllerDashboardWidgetView {

    protected function doAction(): void {
        $this->setResponse(new CControllerResponseData([
            'name' => $this->getInput('name', $this->widget->getName()),
            'description' => $this->fields_values['description'],
            'user' => [
                'debug_mode' => $this->getDebugMode()
            ]
        ]));
    }
}- Open manifest.json and register WidgetView as an action class in the actions/widget.lesson_gauge_chart.view section.
ui/modules/lesson_gauge_chart/manifest.json
{
    "manifest_version": 2.0,
    "id": "lesson_gauge_chart",
    "type": "widget",
    "name": "Gauge chart",
    "namespace": "LessonGaugeChart",
    "version": "1.0",
    "author": "Zabbix SIA",
    "actions": {
        "widget.lesson_gauge_chart.view": {
            "class": "WidgetView"
        }
    }
}- Now you can use the value of the description field, contained in $data['description'], in the widget view. Open views/widget.view.php and replace the static text "Hello, world!" with $data['description'].
ui/modules/lesson_gauge_chart/views/widget.view.php
<?php

/**
 * Gauge chart widget view.
 *
 * @var CView $this
 * @var array $data
 */

(new CWidgetView($data))
    ->addItem(
        new CTag('h1', true, $data['description'])
    )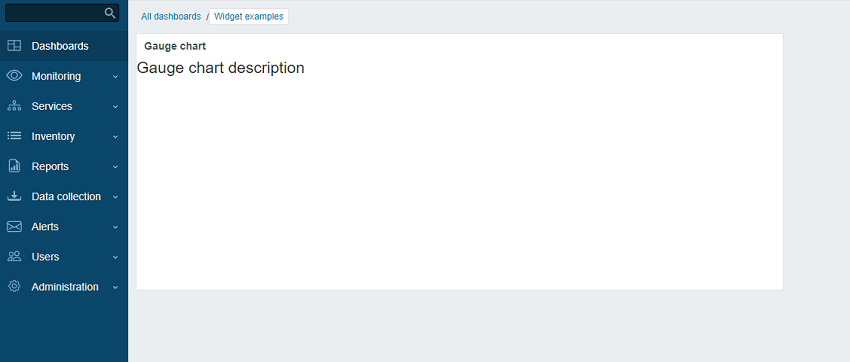
->show();- Refresh the dashboard page. You should now see the widget description text instead of "Hello, world!".
Retrieve an item value via API
The widget should show the last value of an item of user's choice. For that, you need to add the ability to select items in the widget configuration.
In this section, you will learn how to add an item selection field to the widget form and how to add the visual part of this field to the configuration view. Then, the widget controller will be able to retrieve item data and its value via an API request. Once received, the value can be displayed in the widget view.
- Open includes/WidgetForm.php and add the CWidgetFieldMultiSelectItem field. This will allow selecting an item in the configuration form.
ui/modules/lesson_gauge_chart/includes/WidgetForm.php
<?php

namespace Modules\LessonGaugeChart\Includes;

use Zabbix\Widgets\{
    CWidgetField,
    CWidgetForm
};

use Zabbix\Widgets\Fields\{
    CWidgetFieldMultiSelectItem,
    CWidgetFieldTextBox
};

/**
 * Gauge chart widget form.
 */
class WidgetForm extends CWidgetForm {

    public function addFields(): self {
        return $this
            ->addField(
                (new CWidgetFieldMultiSelectItem('itemid', _('Item')))
                    ->setFlags(CWidgetField::FLAG_NOT_EMPTY | CWidgetField::FLAG_LABEL_ASTERISK)
                    ->setMultiple(false)
            )
            ->addField(
                new CWidgetFieldTextBox('description', _('Description'))
            );
    }
}- Open views/widget.edit.php and add the field visual component to the configuration view.
ui/modules/lesson_gauge_chart/views/widget.edit.php
<?php

/**
 * Gauge chart widget form view.
 *
 * @var CView $this
 * @var array $data
 */

(new CWidgetFormView($data))
    ->addField(
        new CWidgetFieldMultiSelectItemView($data['fields']['itemid'], $data['captions']['items']['itemid'])
    )
    ->addField(
        new CWidgetFieldTextBoxView($data['fields']['description'])
    )
->show();-
Return to the dashboard and click on the gear icon in the widget to open the widget configuration form.
-
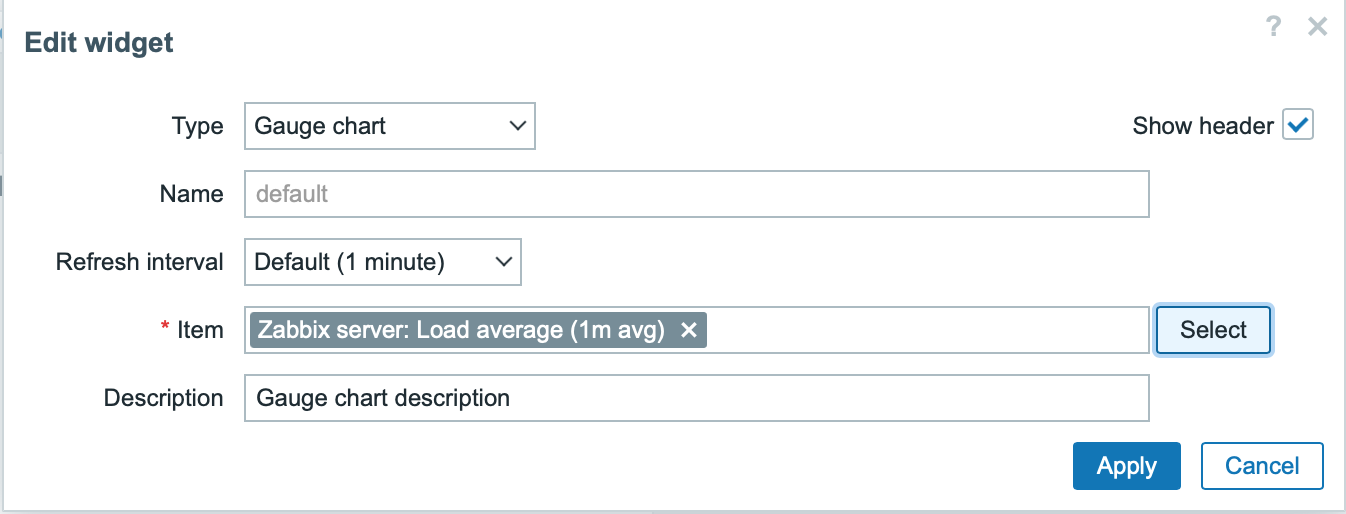
The widget configuration form now contains a new input field Item. Select the host "Zabbix server" and the item "Load average (1m avg)".
-
Click on Apply in the widget configuration form. Then click on Save changes in the top right corner to save the dashboard.
-
Open and modify actions/WidgetView.php.
From now on, the item ID will be available in the widget controller in $this->fields_values['itemid']. The doAction() controller method collects the item data (name, value type, units) using the API method item.get and the item last value using the API method history.get.
ui/modules/lesson_gauge_chart/actions/WidgetView.php
<?php

namespace Modules\LessonGaugeChart\Actions;

use API,
    CControllerDashboardWidgetView,
    CControllerResponseData;

class WidgetView extends CControllerDashboardWidgetView {

    protected function doAction(): void {
        $db_items = API::Item()->get([
            'output' => ['itemid', 'value_type', 'name', 'units'],
            'itemids' => $this->fields_values['itemid'],
            'webitems' => true,
            'filter' => [
                'value_type' => [ITEM_VALUE_TYPE_UINT64, ITEM_VALUE_TYPE_FLOAT]
            ]
        ]);

        $value = null;

        if ($db_items) {
            $item = $db_items[0];

            $history = API::History()->get([
                'output' => API_OUTPUT_EXTEND,
                'itemids' => $item['itemid'],
                'history' => $item['value_type'],
                'sortfield' => 'clock',
                'sortorder' => ZBX_SORT_DOWN,
                'limit' => 1
            ]);

            if ($history) {
                $value = convertUnitsRaw([
                    'value' => $history[0]['value'],
                    'units' => $item['units']
                ]);
            }
        }

        $this->setResponse(new CControllerResponseData([
            'name' => $this->getInput('name', $this->widget->getName()),
            'value' => $value,
            'description' => $this->fields_values['description'],
            'user' => [
                'debug_mode' => $this->getDebugMode()
            ]
        ]));
    }
}- Open views/widget.view.php and add the item value to the widget view.
ui/modules/lesson_gauge_chart/views/widget.view.php
<?php

/**
 * Gauge chart widget view.
 *
 * @var CView $this
 * @var array $data
 */

(new CWidgetView($data))
    ->addItem([
        new CTag('h1', true, $data['description']),
        new CDiv($data['value'] !== null ? $data['value']['value'] : _('No data'))
    ])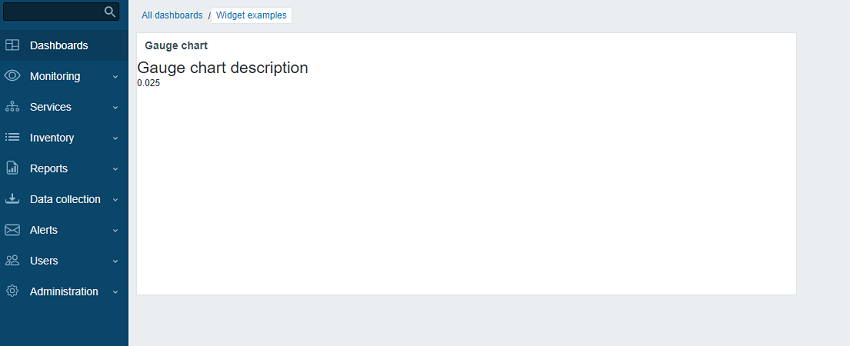
->show();- Refresh the dashboard page. The widget will display the latest item value.
Add JavaScript to the widget
In this section, you will learn how to add Javascript elements to the widget.
You will add:
- A gauge chart made using JavaScript - to show at a glance if the latest value is normal or too high/too low.
- An Advanced configuration section for optional parameters, such as color, minimum and maximum values, units and the Description field created earlier.
- Create a widget.edit.js.php file in the views directory.
JavaScript will be responsible for hiding optional fields behind the Advanced configuration checkbox and initializing the color picker in the configuration view. You can add it to the same directory as the configuration view.
Since the JavaScript for the configuration view should be loaded with the form, you will need to include it into the widget.edit.php file as shown in the next steps.
ui/modules/lesson_gauge_chart/views/widget.edit.js.php
<?php

use Modules\LessonGaugeChart\Widget;

?>

window.widget_lesson_gauge_chart_form = new class {

    init({color_palette}) {
        this._form = document.getElementById('widget-dialogue-form');

        this._advanced_configuration = document.getElementById('adv_conf');
        this._unit_select = document.getElementById('value_units');
        this._unit_value = document.getElementById('value_static_units');

        this._advanced_configuration.addEventListener('change', () => this.updateForm());
        this._unit_select.addEventListener('change', () => this.updateForm());

        colorPalette.setThemeColors(color_palette);

        for (const colorpicker of jQuery('.<?= ZBX_STYLE_COLOR_PICKER ?> input')) {
            jQuery(colorpicker).colorpicker();
        }

        const overlay = overlays_stack.getById('widget_properties');

        for (const event of ['overlay.reload', 'overlay.close']) {
            overlay.$dialogue[0].addEventListener(event, () => { jQuery.colorpicker('hide'); });
        }

        this.updateForm();
    }

    updateForm() {
        const show_advanced_configuration = this._advanced_configuration.checked;

        for (const element of this._form.querySelectorAll('.js-advanced-configuration')) {
            element.style.display = show_advanced_configuration ? '' : 'none';
        }

        this._unit_value.disabled = this._unit_select.value == <?= Widget::UNIT_AUTO ?>;
    }
};- Create a Widget.php file in the main widget directory lesson_gauge_chart to create a new class Widget.
The Widget class will extend the CWidget base class to add/override the default widget settings (in this case - translations). JavaScript, provided below, displays the string "No data" in case of missing data. The "No data" string is present in the Zabbix UI translation files.
If there are any widget constants, it is recommended to also specify them in the Widget class.
ui/modules/lesson_gauge_chart/Widget.php
<?php

namespace Modules\LessonGaugeChart;

use Zabbix\Core\CWidget;

class Widget extends CWidget {

    public const UNIT_AUTO = 0;
    public const UNIT_STATIC = 1;

    public function getTranslationStrings(): array {
        return [
            'class.widget.js' => [
                'No data' => _('No data')
            ]
        ];
    }
}- Open includes/WidgetForm.php and add the new fields: Advanced configuration (checkbox), Color (color picker), Min (numeric field), Max (numeric field), and Units (select).
ui/modules/lesson_gauge_chart/includes/WidgetForm.php
<?php

namespace Modules\LessonGaugeChart\Includes;

use Modules\LessonGaugeChart\Widget;

use Zabbix\Widgets\{
    CWidgetField,
    CWidgetForm
};

use Zabbix\Widgets\Fields\{
    CWidgetFieldCheckBox,
    CWidgetFieldColor,
    CWidgetFieldMultiSelectItem,
    CWidgetFieldNumericBox,
    CWidgetFieldSelect,
    CWidgetFieldTextBox
};

/**
 * Gauge chart widget form.
 */
class WidgetForm extends CWidgetForm {

    public function addFields(): self {
        return $this
            ->addField(
                (new CWidgetFieldMultiSelectItem('itemid', _('Item')))
                    ->setFlags(CWidgetField::FLAG_NOT_EMPTY | CWidgetField::FLAG_LABEL_ASTERISK)
                    ->setMultiple(false)
                    ->setFilterParameter('numeric', true)
            )
            ->addField(
                new CWidgetFieldCheckBox('adv_conf', _('Advanced configuration'))
            )
            ->addField(
                (new CWidgetFieldColor('chart_color', _('Color')))->setDefault('FF0000')
            )
            ->addField(
                (new CWidgetFieldNumericBox('value_min', _('Min')))
                    ->setDefault(0)
                    ->setFlags(CWidgetField::FLAG_NOT_EMPTY | CWidgetField::FLAG_LABEL_ASTERISK)
            )
            ->addField(
                (new CWidgetFieldNumericBox('value_max', _('Max')))
                    ->setDefault(100)
                    ->setFlags(CWidgetField::FLAG_NOT_EMPTY | CWidgetField::FLAG_LABEL_ASTERISK)
            )
            ->addField(
                (new CWidgetFieldSelect('value_units', _('Units'), [
                    Widget::UNIT_AUTO => _x('Auto', 'history source selection method'),
                    Widget::UNIT_STATIC => _x('Static', 'history source selection method')
                ]))->setDefault(Widget::UNIT_AUTO)
            )
            ->addField(
                (new CWidgetFieldTextBox('value_static_units'))
            )
            ->addField(
                new CWidgetFieldTextBox('description', _('Description'))
            );
    }
}- Open views/widget.edit.php and add the field visual components to the configuration view.
The addField() method of the CWidgetFormView class takes a CSS class string as the second parameter. Add the js-advanced-configuration string to those fields and their labels, which should be hidden if Advanced configuration is not selected.
To add a JavaScript file to the configuration view, use the includeJsFile() method. To add inline JavaScript, use the addJavaScript() method.
ui/modules/lesson_gauge_chart/views/widget.edit.php
<?php

/**
 * Gauge chart widget form view.
 *
 * @var CView $this
 * @var array $data
 */

use Zabbix\Widgets\Fields\CWidgetFieldGraphDataSet;

$lefty_units = new CWidgetFieldSelectView($data['fields']['value_units']);
$lefty_static_units = (new CWidgetFieldTextBoxView($data['fields']['value_static_units']))
    ->setPlaceholder(_('value'))
    ->setWidth(ZBX_TEXTAREA_TINY_WIDTH);

(new CWidgetFormView($data))
    ->addField(
        new CWidgetFieldMultiSelectItemView($data['fields']['itemid'], $data['captions']['items']['itemid'])
    )
    ->addField(
        new CWidgetFieldCheckBoxView($data['fields']['adv_conf'])
    )
    ->addField(
        new CWidgetFieldColorView($data['fields']['chart_color']),
        'js-advanced-configuration'
    )
    ->addField(
        new CWidgetFieldNumericBoxView($data['fields']['value_min']),
        'js-advanced-configuration'
    )
    ->addField(
        new CWidgetFieldNumericBoxView($data['fields']['value_max']),
        'js-advanced-configuration'
    )
    ->addItem([
        $lefty_units->getLabel()->addClass('js-advanced-configuration'),
        (new CFormField([
            $lefty_units->getView()->addClass(ZBX_STYLE_FORM_INPUT_MARGIN),
            $lefty_static_units->getView()
        ]))->addClass('js-advanced-configuration')
    ])
    ->addField(
        new CWidgetFieldTextBoxView($data['fields']['description']),
        'js-advanced-configuration'
    )
    ->includeJsFile('widget.edit.js.php')
    ->addJavaScript('widget_lesson_gauge_chart_form.init('.json_encode([
        'color_palette' => CWidgetFieldGraphDataSet::DEFAULT_COLOR_PALETTE
    ], JSON_THROW_ON_ERROR).');')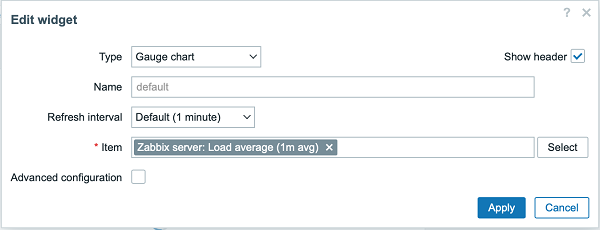
->show();- Return to the dashboard, click on the gear icon in the widget to open the widget configuration form. The widget configuration form now contains a new Advanced configuration checkbox.
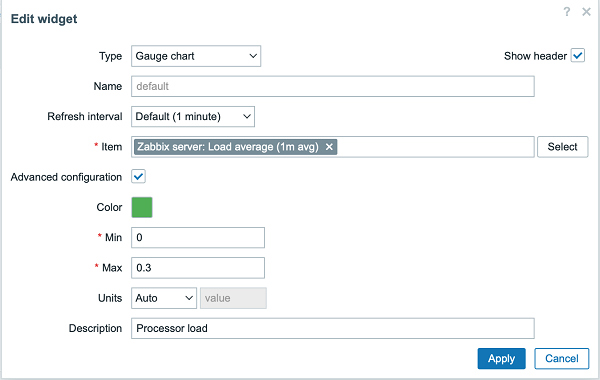
- Mark the Advanced configuration checkbox to see additional widget configuration fields. Fill in the fields with values and select a widget color.
-
Click on Apply in the widget configuration form. Then click on Save changes in the top right corner to save the dashboard.
-
Open actions/WidgetView.php and update the controller.
The $this->fields_values property now contains the values of all the Advanced configuration fields. Finalize the controller to enable passing the configuration and selected item value to the widget view.
ui/modules/lesson_gauge_chart/actions/WidgetView.php
<?php

namespace Modules\LessonGaugeChart\Actions;

use API,
    CControllerDashboardWidgetView,
    CControllerResponseData;

class WidgetView extends CControllerDashboardWidgetView {

    protected function doAction(): void {
        $db_items = API::Item()->get([
            'output' => ['itemid', 'value_type', 'name', 'units'],
            'itemids' => $this->fields_values['itemid'],
            'webitems' => true,
            'filter' => [
                'value_type' => [ITEM_VALUE_TYPE_UINT64, ITEM_VALUE_TYPE_FLOAT]
            ]
        ]);

        $history_value = null;

        if ($db_items) {
            $item = $db_items[0];

            $history = API::History()->get([
                'output' => API_OUTPUT_EXTEND,
                'itemids' => $item['itemid'],
                'history' => $item['value_type'],
                'sortfield' => 'clock',
                'sortorder' => ZBX_SORT_DOWN,
                'limit' => 1
            ]);

            if ($history) {
                $history_value = convertUnitsRaw([
                    'value' => $history[0]['value'],
                    'units' => $item['units']
                ]);
            }
        }

        $this->setResponse(new CControllerResponseData([
            'name' => $this->getInput('name', $this->widget->getName()),
            'history' => $history_value,
            'fields_values' => $this->fields_values,
            'user' => [
                'debug_mode' => $this->getDebugMode()
            ]
        ]));
    }
}- Open and modify views/widget.view.php.
You need to create a container for the gauge chart, which you will draw in the next steps, and a container for the description.
To pass values to JavaScript as a JSON object, use the setVar() method.
ui/modules/lesson_gauge_chart/views/widget.view.php
<?php

/**
 * Gauge chart widget view.
 *
 * @var CView $this
 * @var array $data
 */

(new CWidgetView($data))
    ->addItem([
        (new CDiv())->addClass('chart'),
        $data['fields_values']['description']
            ? (new CDiv($data['fields_values']['description']))->addClass('description')
            : null
    ])
    ->setVar('history', $data['history'])
    ->setVar('fields_values', $data['fields_values'])
->show();-
Create a new directory assets in the lesson_gauge_chart directory. This directory will be used for storing JavaScript, CSS, and potentially any other assets, such as fonts or images.
-
For widget view JavaScript, create a directory js in the assets directory.
-
Create a class.widget.js file in the assets/js directory.
This JavaScript widget class will extend the base JavaScript class of all dashboard widgets - CWidget.
The dashboard relies on a correct implementation of a widget and communicates any relevant information to the widget through calling the respective JavaScript methods. The dashboard also expects the widget to generate events when some interaction occurs. Thus, the CWidget class contains a set of methods with the default implementation of widget behavior, which can be customized by extending the class.
In this case, some customization is necessary, therefore custom logic will be implemented for the following widget behavior:
- widget initialization that is responsible for defining the initial state of the widget (see the _init() method);
- displaying widget contents (that is, drawing the gauge chart) if the widget update process has been successful and without errors (see the _processUpdateResponse(response) method and the related _resizeChart() and _updatedChart() methods)
- resizing the widget (see the resize() method and the related _resizeChart() method)
For other aspects of the gauge chart widget, the default implementation for widget behavior will be used. To learn more about the JavaScript methods of the CWidget class, see: JavaScript.
Since this JavaScript is required for the widget view, it should be loaded with the dashboard page. To enable JavaScript loading, you will need to update the assets/js and js_class parameters of manifest.json as shown in the next step.
ui/modules/lesson_gauge_chart/assets/js/class.widget.js
class WidgetLessonGaugeChart extends CWidget {

    static UNIT_AUTO = 0;
    static UNIT_STATIC = 1;

    _init() {
        super._init();

        this._refresh_frame = null;
        this._chart_container = null;
        this._canvas = null;
        this._chart_color = null;
        this._min = null;
        this._max = null;
        this._value = null;
        this._last_value = null;
        this._units = '';
    }

    _processUpdateResponse(response) {
        if (response.history === null) {
            this._value = null;
            this._units = '';
        }
        else {
            this._value = Number(response.history.value);
            this._units = response.fields_values.value_units == WidgetLessonGaugeChart.UNIT_AUTO
                ? response.history.units
                : response.fields_values.value_static_units;
        }

        this._chart_color = response.fields_values.chart_color;
        this._min = Number(response.fields_values.value_min);
        this._max = Number(response.fields_values.value_max);

        if (this._canvas === null) {
            super._processUpdateResponse(response);

            this._chart_container = this._content_body.querySelector('.chart');
            this._canvas = document.createElement('canvas');

            this._chart_container.appendChild(this._canvas);

            this._resizeChart();
        }
        else {
            this._updatedChart();
        }
    }

    resize() {
        super.resize();

        if (this._state === WIDGET_STATE_ACTIVE) {
            this._resizeChart();
        }
    }

    _resizeChart() {
        const ctx = this._canvas.getContext('2d');
        const dpr = window.devicePixelRatio;

        this._canvas.style.display = 'none';
        const size = Math.min(this._chart_container.offsetWidth, this._chart_container.offsetHeight);
        this._canvas.style.display = '';

        this._canvas.width = size * dpr;
        this._canvas.height = size * dpr;

        ctx.scale(dpr, dpr);

        this._canvas.style.width = `${size}px`;
        this._canvas.style.height = `${size}px`;

        this._refresh_frame = null;

        this._updatedChart();
    }

    _updatedChart() {
        if (this._last_value === null) {
            this._last_value = this._min;
        }

        const start_time = Date.now();
        const end_time = start_time + 400;

        const animate = () => {
            const time = Date.now();

            if (time <= end_time) {
                const progress = (time - start_time) / (end_time - start_time);
                const smooth_progress = 0.5 + Math.sin(Math.PI * (progress - 0.5)) / 2;
                let value = this._value !== null ? this._value : this._min;
                value = (this._last_value + (value - this._last_value) * smooth_progress - this._min) / (this._max - this._min);

                const ctx = this._canvas.getContext('2d');
                const size = this._canvas.width;
                const char_weight = size / 12;
                const char_shadow = 3;
                const char_x = size / 2;
                const char_y = size / 2;
                const char_radius = (size - char_weight) / 2 - char_shadow;

                const font_ratio = 32 / 100;

                ctx.clearRect(0, 0, size, size);

                ctx.beginPath();
                ctx.shadowBlur = char_shadow;
                ctx.shadowColor = '#bbb';
                ctx.strokeStyle = '#eee';
                ctx.lineWidth = char_weight;
                ctx.lineCap = 'round';
                ctx.arc(char_x, char_y, char_radius, Math.PI * 0.749, Math.PI * 2.251, false);
                ctx.stroke();

                ctx.beginPath();
                ctx.strokeStyle = `#${this._chart_color}`;
                ctx.lineWidth = char_weight - 2;
                ctx.lineCap = 'round';
                ctx.arc(char_x, char_y, char_radius, Math.PI * 0.75,
                    Math.PI * (0.75 + (1.5 * Math.min(1, Math.max(0, value)))), false
                    );
                ctx.stroke();

                ctx.shadowBlur = 2;
                ctx.fillStyle = '#1f2c33';
                ctx.font = `${(char_radius * font_ratio)|0}px Arial`;
                ctx.textAlign = 'center';
                ctx.textBaseline = 'middle';
                ctx.fillText(`${this._value !== null ? this._value : t('No data')}${this._units}`,
                    char_x, char_y, size - char_shadow * 4 - char_weight * 2
                );

                ctx.fillStyle = '#768d99';
                ctx.font = `${(char_radius * font_ratio * .5)|0}px Arial`;
                ctx.textBaseline = 'top';

                ctx.textAlign = 'left';
                ctx.fillText(`${this._min}${this._min != '' ? this._units : ''}`,
                    char_weight * .75, size - char_weight * 1.25, size / 2 - char_weight
                );

                ctx.textAlign = 'right';
                ctx.fillText(`${this._max}${this._max != '' ? this._units : ''}`,
                    size - char_weight * .75, size - char_weight * 1.25, size / 2 - char_weight
                );

                requestAnimationFrame(animate);
            }
            else {
                this._last_value = this._value;
            }
        };

        requestAnimationFrame(animate);
    }
}- Open manifest.json and add:
- file name (class.widget.js) to the array in the assets/js section;
- class name (WidgetLessonGaugeChart) to the js_class parameter in the widget section.
The WidgetLessonGaugeChart class will now be automatically loaded with the dashboard.
ui/modules/lesson_gauge_chart/manifest.json
{
    "manifest_version": 2.0,
    "id": "lesson_gauge_chart",
    "type": "widget",
    "name": "Gauge chart",
    "namespace": "LessonGaugeChart",
    "version": "1.0",
    "author": "Zabbix SIA",
    "actions": {
        "widget.lesson_gauge_chart.view": {
            "class": "WidgetView"
        }
    },
    "widget": {
        "js_class": "WidgetLessonGaugeChart"
    },
    "assets": {
        "js": ["class.widget.js"]
    }
}
Add CSS styles to the widget
In this section you will learn how to add custom CSS styles to make the widget look more appealing.
-
For widget styles, create a new directory css in the assets directory.
-
Create a widget.css file in the assets/css directory. To style widget elements, use the selector div.dashboard-widget-{widget id}. To configure CSS for the whole widget, use the selector form.dashboard-widget-{widget id}
ui/modules/lesson_gauge_chart/assets/css/widget.css
div.dashboard-widget-lesson_gauge_chart {
    display: grid;
    grid-template-rows: 1fr;
    padding: 0;
}

div.dashboard-widget-lesson_gauge_chart .chart {
    display: grid;
    align-items: center;
    justify-items: center;
}

div.dashboard-widget-lesson_gauge_chart .chart canvas {
    background: white;
}

div.dashboard-widget-lesson_gauge_chart .description {
    padding-bottom: 8px;
    font-size: 1.750em;
    line-height: 1.2;
    text-align: center;
}

.dashboard-grid-widget-hidden-header div.dashboard-widget-lesson_gauge_chart .chart {
    margin-top: 8px;
}- Open manifest.json and add the CSS file name (widget.css) to the array in the assets/css section. This will allow the CSS styles defined in widget.css to load with the dashboard page.
ui/modules/lesson_gauge_chart/manifest.json
{
    "manifest_version": 2.0,
    "id": "lesson_gauge_chart",
    "type": "widget",
    "name": "Gauge chart",
    "namespace": "LessonGaugeChart",
    "version": "1.0",
    "author": "Zabbix SIA",
    "actions": {
        "widget.lesson_gauge_chart.view": {
            "class": "WidgetView"
        }
    },
    "widget": {
        "js_class": "WidgetLessonGaugeChart"
    },
    "assets": {
        "css": ["widget.css"],
        "js": ["class.widget.js"]
    }
}- Refresh the dashboard page to see the finished version of the widget.