
5 Quoi de neuf dans Zabbix 7.4.0
Voir les modifications incompatibles pour cette version.
Découverte imbriquée de bas niveau
Il est désormais possible de créer une découverte multi-niveaux des objets grâce à l'introduction de modèles de découverte dans une règle de découverte de bas niveau. Par exemple, vous pouvez vouloir découvrir toutes les instances de base de données sur un serveur de base de données, puis découvrir les espaces de tables pour chaque instance, puis découvrir les tables pour chaque espace de tables.
Les modèles de découverte sont des règles de découverte imbriquées au sein d'une règle de découverte "parente". Les modèles de découverte disposent de leurs propres modèles d'élément, de déclencheur, de graphique, d'hôte et de découverte.
Un modèle de découverte imbriqué peut utiliser la même valeur JSON que la règle parente, puis utiliser une "portion" différente des données de la valeur JSON.
Les niveaux d'imbrication des modèles de découverte sont illimités.
Modèles d'hôte sur les hôtes découverts
Les modèles d'hôte sont désormais pris en charge sur les hôtes découverts, ce qui permet à Zabbix de découvrir et de surveiller automatiquement des entités au sein d'autres entités découvertes (par exemple, des hyperviseurs, leurs machines virtuelles et les conteneurs à l'intérieur de ces machines virtuelles).
Vous pouvez créer des modèles d'hôte sur des hôtes découverts en créant des règles de découverte de bas niveau avec des modèles d'hôte ou en liant un modèle avec des modèles d'hôte. Vous pouvez également lier un modèle au modèle d'hôte utilisé pour la découverte, ce qui fera hériter aux hôtes découverts les modèles d'hôte du modèle.
Si votre configuration actuelle inclut des modèles d'hôte qui utilisent des modèles contenant d'autres modèles d'hôte, veuillez consulter les notes de mise à niveau.
Authentification OAuth 2.0
L'authentification OAuth 2.0 est désormais prise en charge pour le protocole SMTP. Pour configurer l'authentification OAuth, sélectionnez "OAuth" dans le paramètre Authentication lors de la configuration d'un type de média de messagerie, puis spécifiez les paramètres pour la récupération des jetons OAuth.
La récupération des jetons OAuth dispose de fonctionnalités automatisées pour les fournisseurs de messagerie Gmail, Gmail relay et Office365. Il suffit de renseigner les valeurs des paramètres Redirection endpoint, Client ID et Client secret. Zabbix remplira automatiquement les autres valeurs requises (voir Valeurs par défaut des URL OAuth par fournisseur).
Assistant de configuration d'hôte
Le nouvel Assistant de configuration d'hôte introduit une interface guidée, étape par étape, pour configurer votre cible de surveillance (appareil, application, service, etc.) dans Zabbix. Il simplifie la configuration des hôtes nouveaux ou existants en guidant les utilisateurs à travers des étapes clés telles que la sélection d'un modèle, l'installation de l'agent Zabbix, l'ajout d'interfaces d'hôte, et plus encore.

L'Assistant de configuration d'hôte est accessible depuis Collecte de données > Hôtes ou le menu d'hôte dans différentes sections de l'interface.
Si vous effectuez une mise à niveau depuis une version antérieure de Zabbix, les modèles doivent être mis à niveau pour fonctionner avec l'Assistant de configuration d'hôte. Pour obtenir des instructions, consultez Mise à niveau des modèles.
Widgets
Carte d'élément
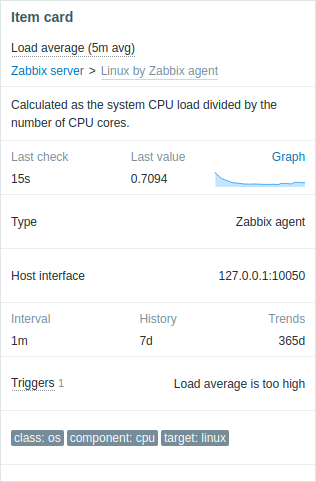
Le widget Carte d'élément a été ajouté aux widgets du tableau de bord, offrant un moyen pratique de consulter en un coup d'œil des informations complètes sur un seul élément.
Historique des éléments
Dans le widget Historique des éléments, la position de défilement sera désormais en bas si les nouvelles valeurs sont configurées pour être placées en bas. Cela est utile pour consulter les dernières valeurs des journaux.
Modification de widget en temps réel
Lors de la modification des widgets, vous pouvez désormais prévisualiser en temps réel les modifications de configuration du widget. De plus, les formulaires de configuration des widgets sont désormais déplaçables, ce qui vous permet de les repositionner selon vos besoins.
Notez que l'aperçu du graphique dans le formulaire du widget de graphique a été supprimé.
Éléments
Élément ICMP ping avec option de nouvelle tentative
Un nouvel icmppingretry[<target>,<retries>,<backoff>,<size>,<timeout>,<options>] contrôle simple a été ajouté pour la surveillance de l'accessibilité de l'hôte par ping ICMP avec la possibilité de modifier les nouvelles tentatives.
Fonctions
Suivi des horodatages
De nouvelles fonctions d'historique ont été ajoutées pour le suivi des horodatages :
firstclock- horodatage de la valeur la plus ancienne dans la période d'évaluation définie ;lastclock- horodatage de la Nième valeur la plus récente dans la période d'évaluation définie ;logtimestamp- horodatage du message de journal de la Nième valeur d'élément de journal la plus récente.
Macros
Suivi du temps de valeur d'élément
De nouvelles macros ont été ajoutées pour le suivi du temps de valeur d'élément :
| Macro | Description |
|---|---|
| {ITEM.LASTVALUE.AGE} | Le temps écoulé entre la dernière collecte de valeur d'élément et l'évaluation de la macro. |
| {ITEM.LASTVALUE.DATE} | La date à laquelle la dernière valeur d'élément a été collectée. |
| {ITEM.LASTVALUE.TIME} | L'heure à laquelle la dernière valeur d'élément a été collectée. |
| {ITEM.LASTVALUE.TIMESTAMP} | L'horodatage auquel la dernière valeur d'élément a été collectée. |
| {ITEM.VALUE.AGE} | Le temps écoulé entre la collecte de la valeur d'élément et l'évaluation de la macro. |
| {ITEM.VALUE.DATE} | La date à laquelle la valeur d'élément a été collectée. |
| {ITEM.VALUE.TIME} | L'heure à laquelle la valeur d'élément a été collectée. |
| {ITEM.VALUE.TIMESTAMP} | L'horodatage auquel la valeur d'élément a été collectée. |
Notifications
Section de menu distincte pour les notifications utilisateur
Pour une meilleure visibilité des médias utilisateur, les notifications utilisateur disposent désormais de leur propre section de menu sous Paramètres utilisateur.
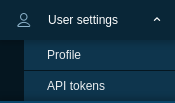
La nouvelle section Notifications contient deux onglets - Média et Notifications de l'interface, qui faisaient auparavant partie de la section du profil utilisateur.
Gestion de ses propres médias utilisateur
Tous les utilisateurs sont désormais autorisés à gérer leurs propres médias par défaut.
Cependant, les autorisations des utilisateurs à modifier leurs propres détails de média peuvent être accordées ou révoquées en fonction de leur rôle utilisateur (voir l'option Créer et modifier ses propres médias).
De plus, les autorisations des utilisateurs Super admin à modifier les détails de média d'autres utilisateurs peuvent également être accordées ou révoquées en fonction de leur rôle utilisateur (voir l'option Créer et modifier les médias utilisateur).
Cartes
Masquer automatiquement les libellés
Il est désormais possible de configurer les libellés des éléments/liens de carte pour qu'ils s'affichent uniquement lorsqu'ils sont survolés ou sélectionnés.
Ce paramètre permet de réduire l'encombrement visuel dans les cartes comportant de nombreux éléments proches les uns des autres.
Le masquage automatique des libellés peut être configuré globalement pour tous les éléments/liens de carte ou pour un élément/lien de carte individuel.
Mise à l'échelle proportionnelle des images d'arrière-plan
Il est désormais possible de mettre à l'échelle proportionnellement les images d'arrière-plan afin qu'elles s'adaptent à la taille de la carte.
Ordre des éléments
Il est désormais possible de placer un élément devant un autre (ou inversement) en cliquant avec le bouton droit de la souris sur l'élément et en sélectionnant les options Avancer/Mettre au premier plan ou Reculer/Mettre à l'arrière-plan.

De plus, si des éléments de carte contiennent à la fois un lien entre eux et une mise en évidence, le lien apparaîtra désormais sous la mise en évidence.
Indicateurs de lien basés sur la valeur de l'élément
Dans les versions précédentes, il était possible d'ajuster le style et la couleur du lien si un déclencheur passait à l'état de problème. Désormais, une fonctionnalité similaire est disponible en fonction des valeurs de l'élément.
Il est possible d'ajuster le style et la couleur du lien si la valeur d'un élément :
- atteint un seuil défini (pour les éléments numériques) ;
- correspond à une expression régulière (pour les éléments textuels).

Processus
Gestion du cache d'historique
Dans certains scénarios de collecte de données, des éléments spécifiques peuvent bloquer temporairement le cache d'historique du serveur/proxy. Cela peut retarder l'écriture des données d'historique dans la base de données et ralentir le système. Pour aider à gérer le cache d'historique, les améliorations suivantes ont été introduites :
- Vidage manuel du cache : La nouvelle commande d'exécution
history_cache_clear=targetpour le serveur Zabbix/proxy permet de vider manuellement le cache d'historique pour un élément spécifique à l'aide de son ID. - Vidage automatique du cache : Lorsque vous désactivez un élément, il est immédiatement supprimé du cache d'historique (sauf sa dernière valeur, qui est conservée pour les journaux). De même, lorsque vous désactivez un hôte, tous ses éléments sont supprimés du cache d'historique (sauf leurs dernières valeurs).
- Journalisation des diagnostics du cache : Lorsque le cache d'historique est plein, le serveur/proxy Zabbix enregistre désormais les informations de diagnostic du cache d'historique à partir de DebugLevel=3 (auparavant DebugLevel=4). Le journal contient les éléments ayant le plus de valeurs dans le cache d'historique.
Pour assurer la stabilité du système à long terme, veillez à ce que la collecte de données soit équilibrée avec les ressources disponibles (performances de la base de données, taille du cache, intervalles de collecte, paramètres des éléments de journal, etc.). Vous pouvez surveiller le cache d'historique Zabbix à l'aide de l'élément interne zabbix[wcache]. Vous pouvez également envisager d'augmenter la taille du cache d'historique pour le serveur Zabbix/proxy.
Statistiques des transactions du synchroniseur d'historique
Le titre du processus du synchroniseur d'historique affiche désormais des statistiques détaillées sur les transactions du synchroniseur d'historique pour le serveur et le proxy Zabbix.
Sécurité
Chiffrement TLS entre l'interface et le serveur
Il est désormais possible de chiffrer la communication entre l'interface Zabbix et le serveur Zabbix à l'aide de TLS. Cette fonctionnalité est contrôlée par de nouveaux paramètres dans la configuration du serveur (TLSListen, TLSFrontendAccept, TLSFrontendCertIssuer, TLSFrontendCertSubject, FrontendAllowedIP).
Résolution indépendante des macros du coffre-fort de secrets par le serveur/proxy
Il est désormais possible de configurer la récupération des valeurs des macros de secrets du coffre-fort par le serveur Zabbix et le proxy Zabbix indépendamment si Résoudre les macros du coffre-fort de secrets par est défini sur "Zabbix server and proxy".
Plugins
Configuration du chemin de requête personnalisé pour les plugins chargeables
Le paramètre Plugins.*.CustomQueriesPath dans les fichiers de configuration des plugins de Zabbix agent 2 pour MySQL, Oracle, et PostgreSQL, ainsi que Plugins.MSSQL.CustomQueriesDir pour MSSQL, dispose désormais d'une valeur par défaut. Cette fonctionnalité est désactivée par défaut et peut être activée à l'aide du paramètre Plugins.*.CustomQueriesEnabled récemment introduit.
Interface
Validation en ligne dans les formulaires
Les formulaires d'interface suivants prennent désormais en charge la validation en ligne, en affichant immédiatement toute erreur de saisie après le remplissage des champs :
- Configuration du modèle
- Configuration de l'hôte
- Configuration de l'élément et du prototype d'élément
- Configuration du déclencheur et du prototype de déclencheur
- Administration des modules
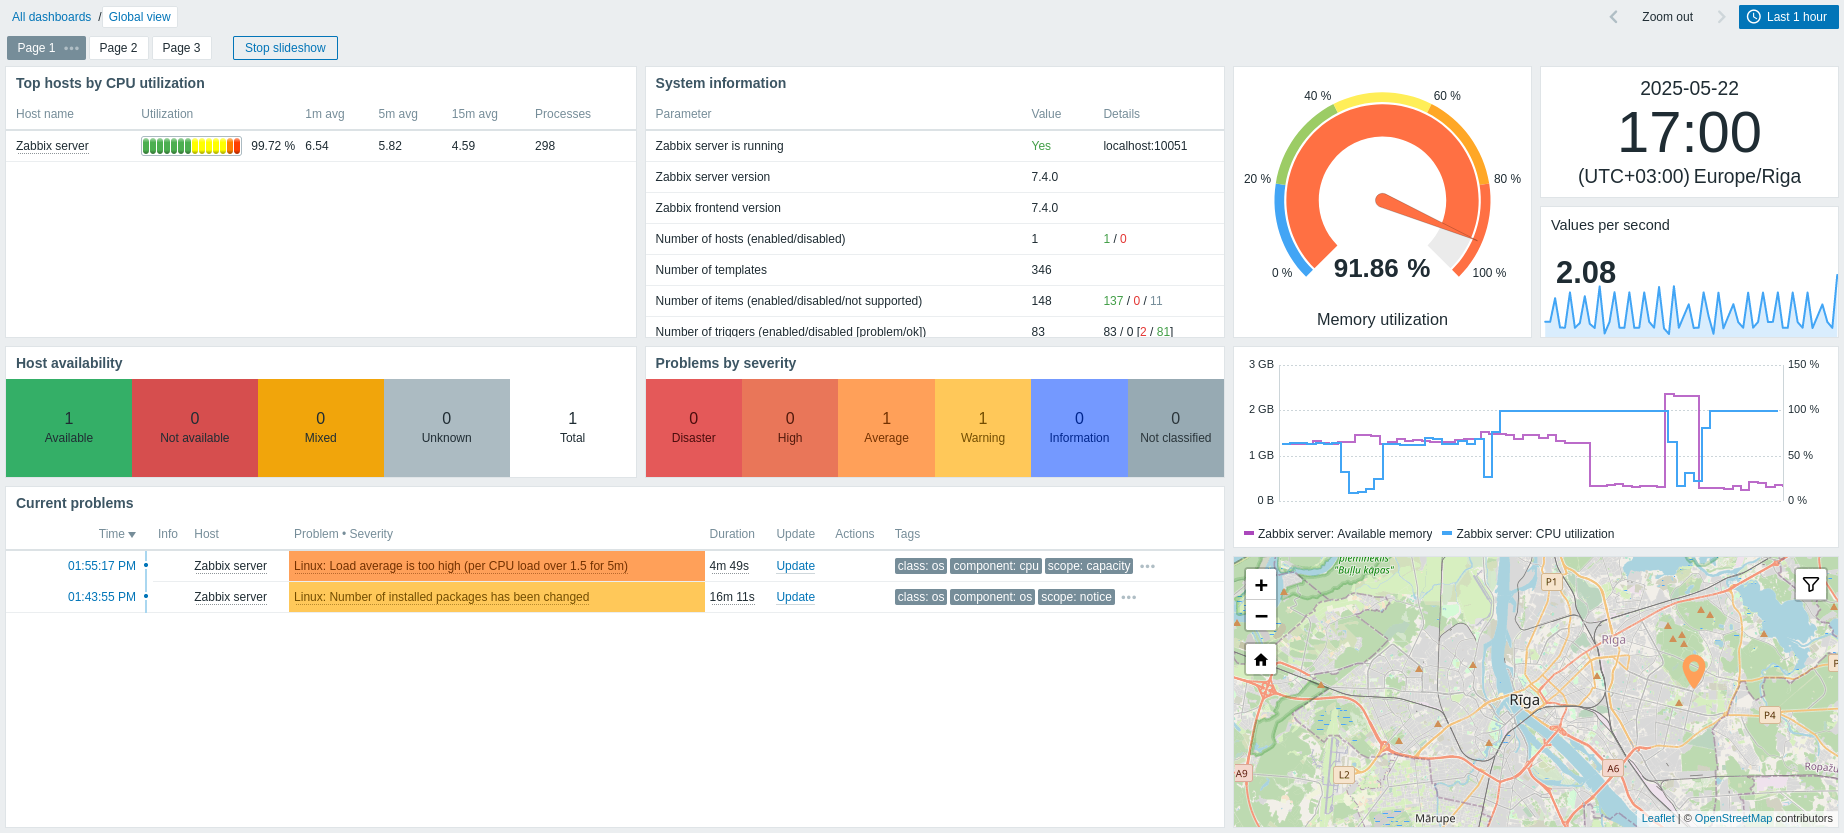
Tableau de bord par défaut mis à jour
Le tableau de bord par défaut Global view dans les nouvelles installations de Zabbix a été mis à jour afin d'inclure les derniers widgets de tableau de bord.
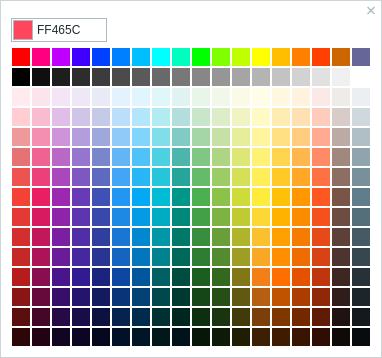
Sélecteur de couleurs amélioré avec prise en charge des palettes
Le sélecteur de couleurs des widgets graph et pie chart a été repensé afin d’améliorer la facilité d’utilisation. En plus des couleurs unies et de la saisie hexadécimale, vous pouvez désormais basculer vers l’onglet Palette et choisir parmi des rangées de couleurs prédéfinies — chaque série reçoit sa propre teinte distincte pour une différenciation plus claire. Le sélecteur offre également une navigation complète au clavier et une validation en temps réel.
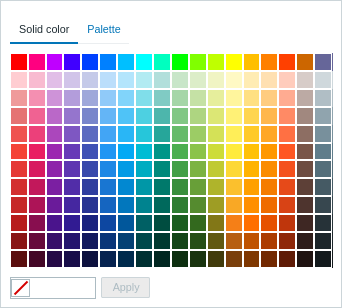 |
Dans Zabbix 7.4 (onglet Couleur unie) |
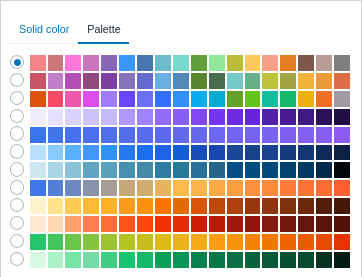 |
Dans Zabbix 7.4 (onglet Palette de couleurs) |
 |
Avant Zabbix 7.4 |
Formulaires modaux
Plusieurs formulaires de l'interface s'ouvrent désormais dans des fenêtres modales (pop-up) :
- configuration du graphe
- configuration du prototype de graphe
Copie plus facile pour les résultats de test de prétraitement
Il est désormais plus facile de copier les valeurs dans les résultats de test de prétraitement grâce au bouton Copier dans le presse-papiers ajouté.

Notez qu'un bouton similaire remplace désormais le lien Copier pour les jetons API créés.
Documentation
Pages de documentation consolidées pour les versions mineures
La documentation de publication des versions mineures d'une version majeure de Zabbix sera désormais regroupée dans des pages de documentation uniques pour les nouvelles fonctionnalités et les notes de mise à niveau, respectivement.