
Создание виджета (руководство)
Это пошаговое руководство, которое показывает, как создать простой виджет информационной панели. Вы можете скачать все файлы этого виджета в виде ZIP-архива: lesson_gauge_chart.zip.
Что вы создадите
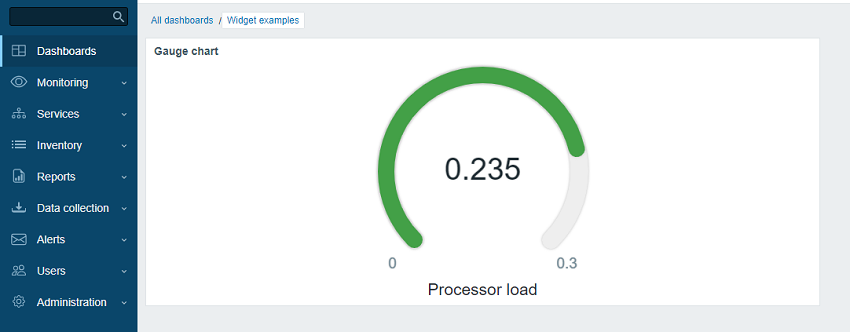
В ходе этого руководства вы сначала создадите базовый виджет "Hello, world!", а затем преобразуете его в более продвинутый виджет, который отображает значение элемента данных в виде диаграммы-датчика. Вот как будет выглядеть готовый виджет:
Часть I - "Hello, world!"
В этом разделе вы узнаете, как создать минимально необходимые элементы виджета и добавить новый виджет в веб-интерфейс Zabbix.
Добавление пустого виджета во веб-интерфейс Zabbix
- Создайте каталог lesson_gauge_chart в каталоге modules вашей установки веб-интерфейса Zabbix (например, zabbix/ui/modules).
Все пользовательские виджеты рассматриваются как внешние модули и должны быть добавлены в каталог modules вашей установки веб-интерфейса Zabbix (например, zabbix/ui/modules). Каталог zabbix/ui/widgets зарезервирован для встроенных виджетов Zabbix и обновляется вместе с веб-интерфейсом Zabbix.
- Создайте файл manifest.json с базовыми метаданными виджета (см. описание поддерживаемых параметров).
ui/modules/lesson_gauge_chart/manifest.json
{
    "manifest_version": 2.0,
    "id": "lesson_gauge_chart",
    "type": "widget",
    "name": "Gauge chart",
    "namespace": "LessonGaugeChart",
    "version": "1.1",
    "author": "Zabbix"
}- В веб-интерфейсе Zabbix перейдите в раздел Administration > General > Modules и нажмите кнопку Scan directory.
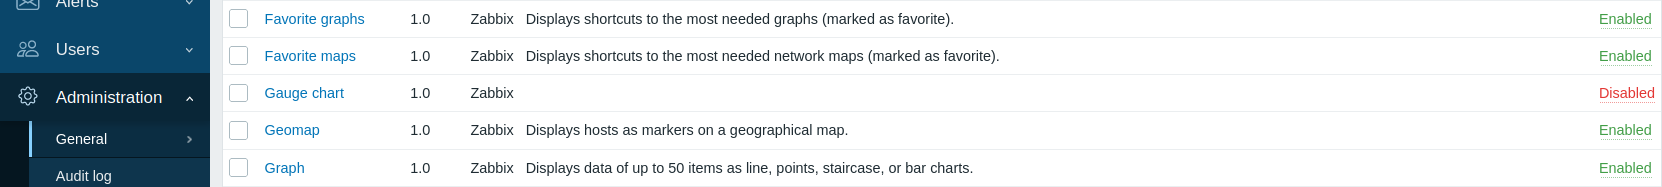
- Найдите в списке новый модуль Gauge chart и нажмите гиперссылку "Disabled", чтобы изменить статус модуля с "Disabled" на "Enabled" (если модуль не отображается в списке, см. раздел troubleshooting).
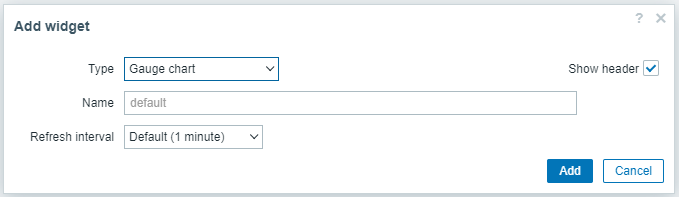
- Откройте дашборд, переключите его в режим редактирования и добавьте новый виджет. В поле Type выберите "Gauge chart".
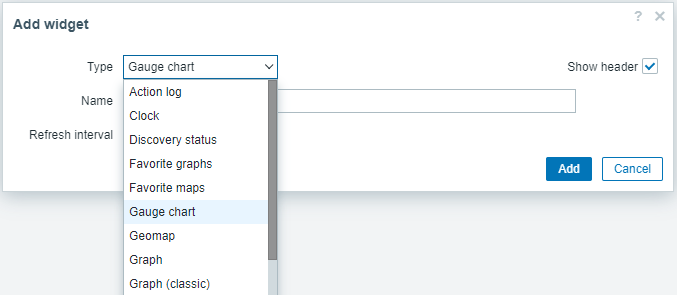
- На этом этапе конфигурация виджета Gauge chart содержит только общие поля виджета Name и Refresh interval. Нажмите Add, чтобы добавить виджет на дашборд.
- На дашборде должен появиться пустой виджет. Нажмите Save changes в правом верхнем углу, чтобы сохранить дашборд.
![]()
Добавление представления виджета
Файл view виджета должен находиться в каталоге views (для этого руководства — ui/modules/lesson_gauge_chart/views/). Если файл имеет имя по умолчанию widget.view.php, регистрировать его в файле manifest.json не нужно. Если файл имеет другое имя, укажите его в разделе actions/widget.lesson_gauge_chart.view файла manifest.json.
-
Создайте каталог views в каталоге lesson_gauge_chart.
-
Создайте файл widget.view.php в каталоге views.
ui/modules/lesson_gauge_chart/views/widget.view.php
<?php

/**
 * Представление виджета Gauge chart.
 *
 * @var CView $this
 * @var array $data
 */

(new CWidgetView($data))
    ->addItem(
        new CTag('h1', true, 'Hello, world!')
    )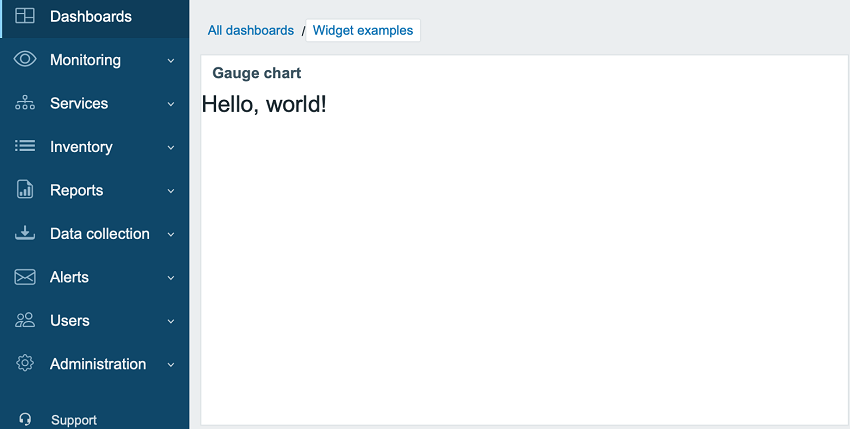
->show();- Обновите панель мониторинга. Теперь виджет Gauge chart отображает "Hello, world!".
Часть II - Диаграмма измерений
Добавление настроек в представление конфигурации и использование их в представлении виджета
В этом разделе вы узнаете, как добавить поле конфигурации виджета и вывести введенное значение в представлении виджета в виде текста.
Конфигурация виджета состоит из формы (Zabbix\Widgets\CWidgetForm) и представления формы виджета (widget.edit.php). Чтобы добавить поля (Zabbix\Widgets\CWidgetField), нужно создать класс WidgetForm, который будет расширять Zabbix\Widgets\CWidgetForm.
Форма содержит набор полей (Zabbix\Widgets\CWidgetField) различных типов, которые используются для проверки значений, введенных пользователем. Поле формы (Zabbix\Widgets\CWidgetField) для каждого типа элемента ввода преобразует значение в единый формат для хранения в базе данных.
Файл form виджета должен находиться в каталоге includes (для этого руководства — ui/modules/lesson_gauge_chart/includes/). Если файл имеет имя по умолчанию WidgetForm.php, регистрировать его в файле manifest.json не нужно. Если файл имеет другое имя, укажите его в разделе widget/form_class файла manifest.json.
-
Создайте новый каталог includes в каталоге lesson_gauge_chart.
-
Создайте файл WidgetForm.php в каталоге includes.
ui/modules/lesson_gauge_chart/includes/WidgetForm.php
<?php

namespace Modules\LessonGaugeChart\Includes;

use Zabbix\Widgets\CWidgetForm;

class WidgetForm extends CWidgetForm {
}- Добавьте поле Description в форму конфигурации виджета. Это обычное текстовое поле, в которое пользователь может ввести любой набор символов. Для него можно использовать класс CWidgetFieldTextBox.
ui/modules/lesson_gauge_chart/includes/WidgetForm.php
<?php

namespace Modules\LessonGaugeChart\Includes;

use Zabbix\Widgets\CWidgetForm;

use Zabbix\Widgets\Fields\CWidgetFieldTextBox;

class WidgetForm extends CWidgetForm {

    public function addFields(): self {
        return $this
            ->addField(
               new CWidgetFieldTextBox('description', _('Description'))
            );
   }
}- В каталоге views создайте файл представления конфигурации виджета widget.edit.php и добавьте представление для нового поля Description. Для класса поля CWidgetFieldTextBox представлением является CWidgetFieldTextBoxView.
ui/modules/lesson_gauge_chart/views/widget.edit.php
<?php

/**
 * Представление формы виджета Gauge chart.
 *
 * @var CView $this
 * @var array $data
 */

(new CWidgetFormView($data))
    ->addField(
        new CWidgetFieldTextBoxView($data['fields']['description'])
    )
->show();-
Перейдите на панель и нажмите значок шестеренки в виджете, чтобы открыть форму конфигурации виджета.
-
Теперь форма конфигурации виджета содержит новое текстовое поле Description. Введите любое значение, например Gauge chart description.
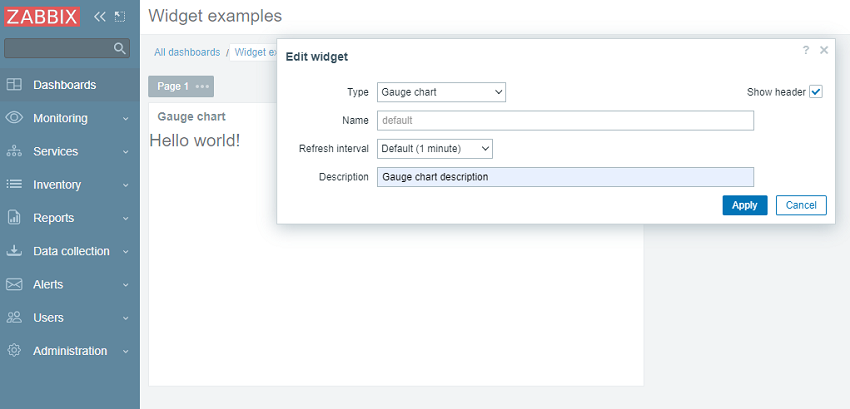
- Нажмите Apply в форме конфигурации виджета. Затем нажмите Save changes в правом верхнем углу, чтобы сохранить панель. Обратите внимание, что новое описание нигде не отображается, и виджет по-прежнему показывает "Hello, world!".
Чтобы новое описание появилось в виджете, значение поля Description нужно получить из базы данных и передать в представление виджета. Для этого необходимо создать класс действия.
-
Создайте новый каталог actions в каталоге lesson_gauge_chart.
-
Создайте файл WidgetView.php в каталоге actions. Класс действия WidgetView будет расширять класс CControllerDashboardWidgetView.
Значения полей конфигурации виджета хранятся в свойстве $fields_values класса действия.
ui/modules/lesson_gauge_chart/actions/WidgetView.php
<?php

namespace Modules\LessonGaugeChart\Actions;

use CControllerDashboardWidgetView,
    CControllerResponseData;

class WidgetView extends CControllerDashboardWidgetView {

    protected function doAction(): void {
        $this->setResponse(new CControllerResponseData([
            'name' => $this->getInput('name', $this->widget->getName()),
            'description' => $this->fields_values['description'],
            'user' => [
                'debug_mode' => $this->getDebugMode()
            ]
        ]));
    }
}- Откройте manifest.json и зарегистрируйте WidgetView как класс действия в разделе actions/widget.lesson_gauge_chart.view.
ui/modules/lesson_gauge_chart/manifest.json
{
    "manifest_version": 2.0,
    "id": "lesson_gauge_chart",
    "type": "widget",
    "name": "Gauge chart",
    "namespace": "LessonGaugeChart",
    "version": "1.0",
    "author": "Zabbix",
    "actions": {
        "widget.lesson_gauge_chart.view": {
            "class": "WidgetView"
        }
    }
}- Теперь вы можете использовать значение поля description, содержащееся в $data['description'], в представлении виджета. Откройте views/widget.view.php и замените статический текст "Hello, world!" на $data['description'].
ui/modules/lesson_gauge_chart/views/widget.view.php
<?php

/**
 * Представление виджета Gauge chart.
 *
 * @var CView $this
 * @var array $data
 */

(new CWidgetView($data))
    ->addItem(
        new CTag('h1', true, $data['description'])
    )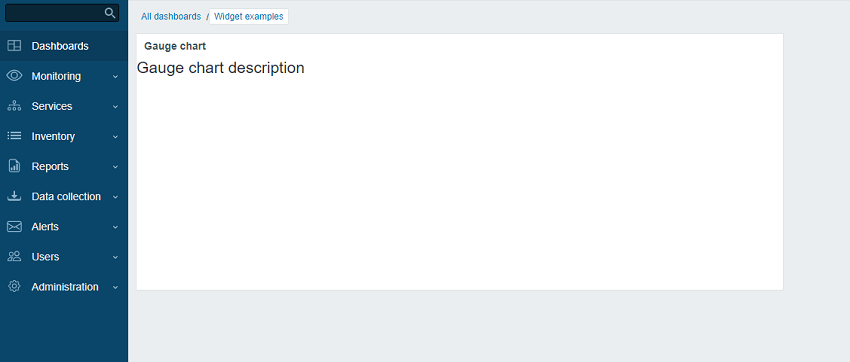
->show();- Обновите страницу панели. Теперь вместо "Hello, world!" вы должны видеть текст описания виджета.
Получение значения элемента данных через API
Виджет должен отображать последнее значение элемента данных, выбранного пользователем. Для этого нужно добавить возможность выбора элементов данных в конфигурации виджета.
В этом разделе вы узнаете, как добавить поле выбора элемента данных в форму виджета и как добавить визуальную часть этого поля в представление конфигурации. Затем контроллер виджета сможет получать данные элемента данных и его значение через API-запрос. После получения значение можно отобразить в представлении виджета.
- Откройте includes/WidgetForm.php и добавьте поле CWidgetFieldMultiSelectItem. Это позволит выбирать элемент данных в форме конфигурации.
ui/modules/lesson_gauge_chart/includes/WidgetForm.php
<?php

namespace Modules\LessonGaugeChart\Includes;

use Zabbix\Widgets\{
    CWidgetField,
    CWidgetForm
};

use Zabbix\Widgets\Fields\{
    CWidgetFieldMultiSelectItem,
    CWidgetFieldTextBox
};

/**
 * Форма виджета диаграммы-датчика.
 */
class WidgetForm extends CWidgetForm {

    public function addFields(): self {
        return $this
            ->addField(
                (new CWidgetFieldMultiSelectItem('itemid', _('Item')))
                    ->setFlags(CWidgetField::FLAG_NOT_EMPTY | CWidgetField::FLAG_LABEL_ASTERISK)
                    ->setMultiple(false)
            )
            ->addField(
                new CWidgetFieldTextBox('description', _('Description'))
            );
    }
}- Откройте views/widget.edit.php и добавьте визуальный компонент поля в представление конфигурации.
ui/modules/lesson_gauge_chart/views/widget.edit.php
<?php

/**
 * Представление формы виджета диаграммы-датчика.
 *
 * @var CView $this
 * @var array $data
 */

(new CWidgetFormView($data))
    ->addField(
        new CWidgetFieldMultiSelectItemView($data['fields']['itemid'])
    )
    ->addField(
        new CWidgetFieldTextBoxView($data['fields']['description'])
    )
->show();-
Вернитесь на панель и нажмите значок шестеренки в виджете, чтобы открыть форму конфигурации виджета.
-
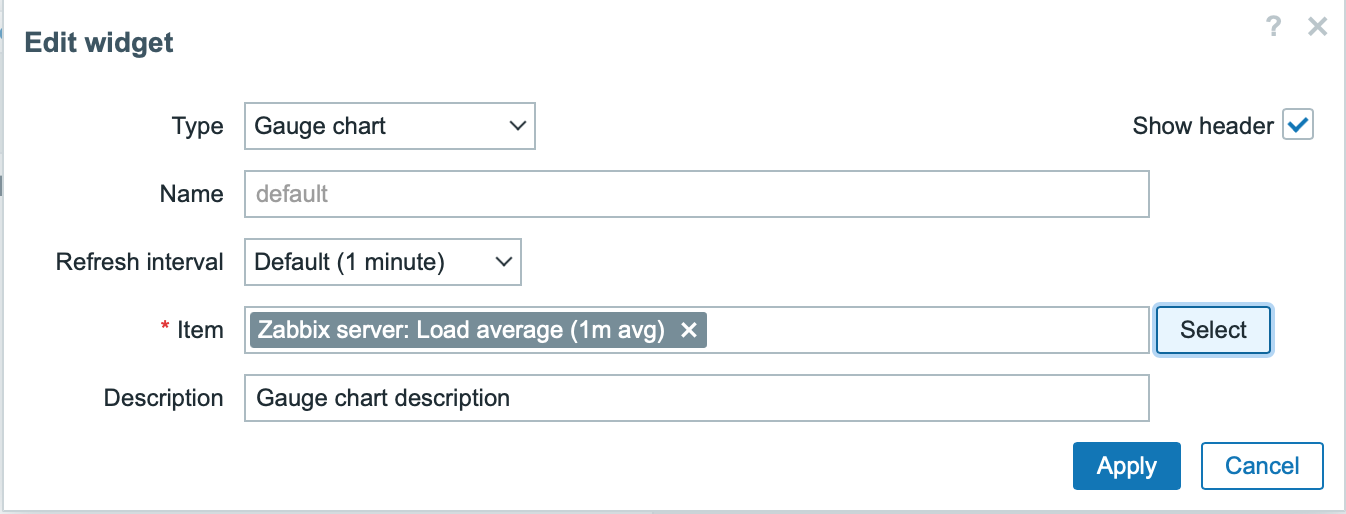
Теперь форма конфигурации виджета содержит новое поле ввода Item. Выберите узел сети "Zabbix server" и элемент данных "Load average (1m avg)".
-
Нажмите Apply в форме конфигурации виджета. Затем нажмите Save changes в правом верхнем углу, чтобы сохранить панель.
-
Откройте и измените actions/WidgetView.php.
Теперь идентификатор элемента данных будет доступен в контроллере виджета в $this->fields_values['itemid']. Метод контроллера doAction() получает данные элемента данных (имя, тип значения, единицы измерения) с помощью API-метода item.get и последнее значение элемента данных с помощью API-метода history.get.
ui/modules/lesson_gauge_chart/actions/WidgetView.php
<?php

namespace Modules\LessonGaugeChart\Actions;

use API,
    CControllerDashboardWidgetView,
    CControllerResponseData;

class WidgetView extends CControllerDashboardWidgetView {

    protected function doAction(): void {
        $db_items = API::Item()->get([
            'output' => ['itemid', 'value_type', 'name', 'units'],
            'itemids' => $this->fields_values['itemid'],
            'webitems' => true,
            'filter' => [
                'value_type' => [ITEM_VALUE_TYPE_UINT64, ITEM_VALUE_TYPE_FLOAT]
            ]
        ]);

        $value = null;

        if ($db_items) {
            $item = $db_items[0];

            $history = API::History()->get([
                'output' => API_OUTPUT_EXTEND,
                'itemids' => $item['itemid'],
                'history' => $item['value_type'],
                'sortfield' => 'clock',
                'sortorder' => ZBX_SORT_DOWN,
                'limit' => 1
            ]);

            if ($history) {
                $value = convertUnitsRaw([
                    'value' => $history[0]['value'],
                    'units' => $item['units']
                ]);
            }
        }

        $this->setResponse(new CControllerResponseData([
            'name' => $this->getInput('name', $this->widget->getName()),
            'value' => $value,
            'description' => $this->fields_values['description'],
            'user' => [
                'debug_mode' => $this->getDebugMode()
            ]
        ]));
    }
}- Откройте views/widget.view.php и добавьте значение элемента данных в представление виджета.
ui/modules/lesson_gauge_chart/views/widget.view.php
<?php

/**
 * Представление виджета диаграммы-датчика.
 *
 * @var CView $this
 * @var array $data
 */

(new CWidgetView($data))
    ->addItem([
        new CTag('h1', true, $data['description']),
        new CDiv($data['value'] !== null ? $data['value']['value'] : _('No data'))
    ])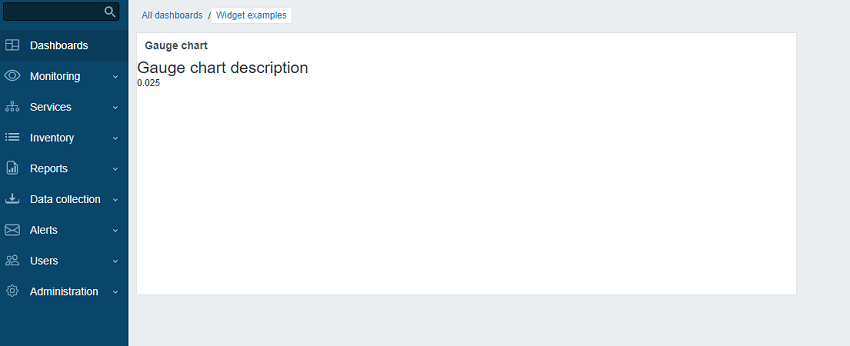
->show();- Обновите страницу панели. Виджет будет отображать последнее значение элемента данных.
Добавление расширенных настроек конфигурации в представление конфигурации
В этом разделе вы узнаете, как добавить сворачиваемый/разворачиваемый раздел Advanced configuration с необязательными параметрами, такими как цвет, минимальное и максимальное значения, единицы измерения и поле Description, созданное ранее.
- Создайте файл Widget.php в основном каталоге виджета lesson_gauge_chart, чтобы создать новый класс Widget.
Класс Widget будет расширять базовый класс CWidget, чтобы добавлять/переопределять настройки виджета по умолчанию (в данном случае - переводы). JavaScript, приведенный ниже, отображает строку "No data" в случае отсутствия данных. Строка "No data" присутствует в файлах перевода интерфейса Zabbix.
Если у виджета есть какие-либо константы, рекомендуется также указать их в классе Widget.
ui/modules/lesson_gauge_chart/Widget.php
<?php

namespace Modules\LessonGaugeChart;

use Zabbix\Core\CWidget;

class Widget extends CWidget {

    public const UNIT_AUTO = 0;
    public const UNIT_STATIC = 1;

    public function getTranslationStrings(): array {
        return [
            'class.widget.js' => [
                'No data' => _('No data')
            ]
        ];
    }
}- Откройте includes/WidgetForm.php и добавьте новые поля Color (выбор цвета), Min (числовое поле), Max (числовое поле) и Units (список), а также задайте палитру цветов по умолчанию для выбора цвета, чтобы ее можно было использовать на следующих шагах.
ui/modules/lesson_gauge_chart/includes/WidgetForm.php
<?php

namespace Modules\LessonGaugeChart\Includes;

use Modules\LessonGaugeChart\Widget;

use Zabbix\Widgets\{
    CWidgetField,
    CWidgetForm
};

use Zabbix\Widgets\Fields\{
    CWidgetFieldColor,
    CWidgetFieldMultiSelectItem,
    CWidgetFieldNumericBox,
    CWidgetFieldSelect,
    CWidgetFieldTextBox
};

/**
 * Форма виджета диаграммы-датчика.
 */
class WidgetForm extends CWidgetForm {

    public const DEFAULT_COLOR_PALETTE = [
        'FF465C', 'B0AF07', '0EC9AC', '524BBC', 'ED1248', 'D1E754', '2AB5FF', '385CC7', 'EC1594', 'BAE37D',
        '6AC8FF', 'EE2B29', '3CA20D', '6F4BBC', '00A1FF', 'F3601B', '1CAE59', '45CFDB', '894BBC', '6D6D6D'
    ];

    public function addFields(): self {
        return $this
            ->addField(
                (new CWidgetFieldMultiSelectItem('itemid', _('Item')))
                    ->setFlags(CWidgetField::FLAG_NOT_EMPTY | CWidgetField::FLAG_LABEL_ASTERISK)
                    ->setMultiple(false)
            )
            ->addField(
                (new CWidgetFieldColor('chart_color', _('Color')))->setDefault('FF0000')
            )
            ->addField(
                (new CWidgetFieldNumericBox('value_min', _('Min')))
                    ->setDefault(0)
                    ->setFlags(CWidgetField::FLAG_NOT_EMPTY | CWidgetField::FLAG_LABEL_ASTERISK)
            )
            ->addField(
                (new CWidgetFieldNumericBox('value_max', _('Max')))
                    ->setDefault(100)
                    ->setFlags(CWidgetField::FLAG_NOT_EMPTY | CWidgetField::FLAG_LABEL_ASTERISK)
            )
            ->addField(
                (new CWidgetFieldSelect('value_units', _('Units'), [
                    Widget::UNIT_AUTO => _x('Auto', 'history source selection method'),
                    Widget::UNIT_STATIC => _x('Static', 'history source selection method')
                ]))->setDefault(Widget::UNIT_AUTO)
            )
            ->addField(
                (new CWidgetFieldTextBox('value_static_units'))
            )
            ->addField(
                new CWidgetFieldTextBox('description', _('Description'))
            );
    }
}- Откройте views/widget.edit.php и добавьте визуальные компоненты полей в представление конфигурации.
ui/modules/lesson_gauge_chart/views/widget.edit.php
<?php

/**
 * Представление формы виджета диаграммы-датчика.
 *
 * @var CView $this
 * @var array $data
 */

$lefty_units = new CWidgetFieldSelectView($data['fields']['value_units']);
$lefty_static_units = (new CWidgetFieldTextBoxView($data['fields']['value_static_units']))
    ->setPlaceholder(_('value'))
    ->setWidth(ZBX_TEXTAREA_TINY_WIDTH);

(new CWidgetFormView($data))
    ->addField(
        (new CWidgetFieldMultiSelectItemView($data['fields']['itemid']))
            ->setPopupParameter('numeric', true)
    )
    ->addFieldset(
        (new CWidgetFormFieldsetCollapsibleView(_('Advanced configuration')))
            ->addField(
                new CWidgetFieldColorView($data['fields']['chart_color'])
            )
            ->addField(
                new CWidgetFieldNumericBoxView($data['fields']['value_min'])
            )
            ->addField(
                new CWidgetFieldNumericBoxView($data['fields']['value_max'])
            )
            ->addItem([
                $lefty_units->getLabel(),
                (new CFormField([
                    $lefty_units->getView()->addClass(ZBX_STYLE_FORM_INPUT_MARGIN),
                    $lefty_static_units->getView()
                ]))
            ])
            ->addField(
                new CWidgetFieldTextBoxView($data['fields']['description'])
            )
    )
    ->show();
Метод addField() класса CWidgetFormView принимает строку с CSS-классом в качестве второго параметра.
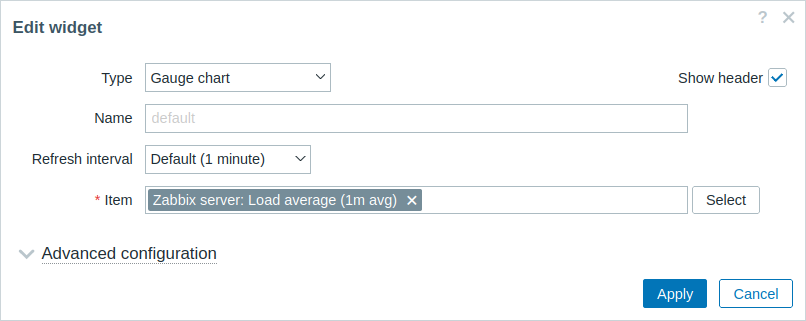
- Вернитесь на панель, переключитесь в режим редактирования и нажмите значок шестеренки в виджете, чтобы открыть форму конфигурации виджета. Теперь форма конфигурации виджета содержит новый сворачиваемый/разворачиваемый раздел Advanced configuration.
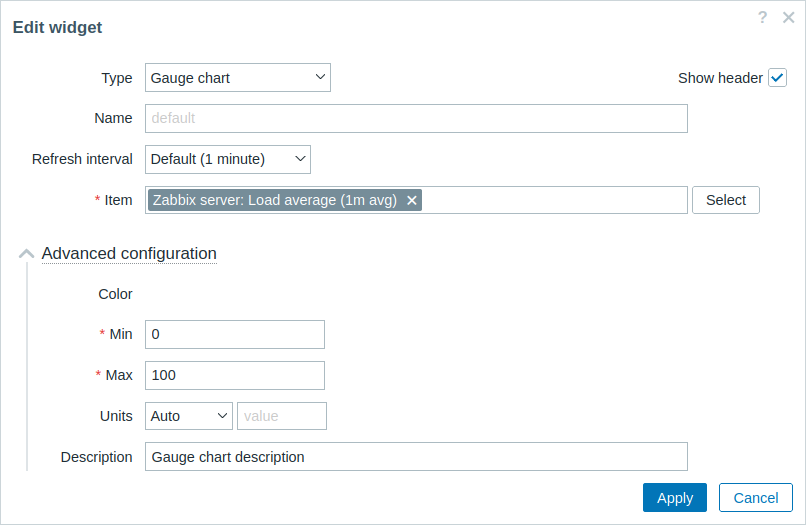
- Разверните раздел Advanced configuration, чтобы увидеть дополнительные поля конфигурации виджета. Обратите внимание, что у поля Color пока нет выбора цвета. Это связано с тем, что выбор цвета должен инициализироваться с помощью JavaScript, который будет добавлен в следующем разделе - Add JavaScript to the widget.
Добавление JavaScript в виджет
В этом разделе вы узнаете, как добавить диаграмму-датчик, созданную с помощью JavaScript, которая показывает, является ли последнее значение нормальным или слишком высоким/слишком низким.
- Создайте файл widget.edit.js.php в каталоге views.
JavaScript будет отвечать за инициализацию палитры цветов в окне конфигурации.
ui/modules/lesson_gauge_chart/views/widget.edit.js.php
<?php

use Modules\LessonGaugeChart\Widget;

?>

window.widget_lesson_gauge_chart_form = new class {

    init({color_palette}) {
        this._unit_select = document.getElementById('value_units');
        this._unit_value = document.getElementById('value_static_units');

        this._unit_select.addEventListener('change', () => this.updateForm());

        colorPalette.setThemeColors(color_palette);

        for (const colorpicker of jQuery('.<?= ZBX_STYLE_COLOR_PICKER ?> input')) {
            jQuery(colorpicker).colorpicker();
        }

        const overlay = overlays_stack.getById('widget_properties');

        for (const event of ['overlay.reload', 'overlay.close']) {
            overlay.$dialogue[0].addEventListener(event, () => { jQuery.colorpicker('hide'); });
        }

        this.updateForm();
    }

    updateForm() {
        this._unit_value.disabled = this._unit_select.value == <?= Widget::UNIT_AUTO ?>;
    }
};- Откройте views/widget.edit.php и добавьте файл widget.edit.js.php с JavaScript в представление конфигурации. Для этого используйте метод includeJsFile(). Чтобы добавить встроенный JavaScript, используйте метод addJavaScript().
ui/modules/lesson_gauge_chart/views/widget.edit.php
<?php

/**
 * Gauge chart widget form view.
 *
 * @var CView $this
 * @var array $data
 */

use Modules\LessonGaugeChart\Includes\WidgetForm;

$lefty_units = new CWidgetFieldSelectView($data['fields']['value_units']);
$lefty_static_units = (new CWidgetFieldTextBoxView($data['fields']['value_static_units']))
    ->setPlaceholder(_('value'))
    ->setWidth(ZBX_TEXTAREA_TINY_WIDTH);

(new CWidgetFormView($data))
    ->addField(
        (new CWidgetFieldMultiSelectItemView($data['fields']['itemid']))
            ->setPopupParameter('numeric', true)
    )
    ->addFieldset(
        (new CWidgetFormFieldsetCollapsibleView(_('Advanced configuration')))
            ->addField(
                new CWidgetFieldColorView($data['fields']['chart_color'])
            )
            ->addField(
                new CWidgetFieldNumericBoxView($data['fields']['value_min'])
            )
            ->addField(
                new CWidgetFieldNumericBoxView($data['fields']['value_max'])
            )
            ->addItem([
                $lefty_units->getLabel(),
                (new CFormField([
                    $lefty_units->getView()->addClass(ZBX_STYLE_FORM_INPUT_MARGIN),
                    $lefty_static_units->getView()
                ]))
            ])
            ->addField(
                new CWidgetFieldTextBoxView($data['fields']['description'])
            )
    )
    ->includeJsFile('widget.edit.js.php')
    ->addJavaScript('widget_lesson_gauge_chart_form.init('.json_encode([
        'color_palette' => WidgetForm::DEFAULT_COLOR_PALETTE
    ], JSON_THROW_ON_ERROR).');')
->show();- Вернитесь на панель, нажмите значок шестеренки в виджете, чтобы открыть форму конфигурации виджета. Теперь разверните раздел Advanced configuration, чтобы увидеть инициализированную палитру цветов. Заполните поля значениями и выберите цвет для диаграммы-датчика.
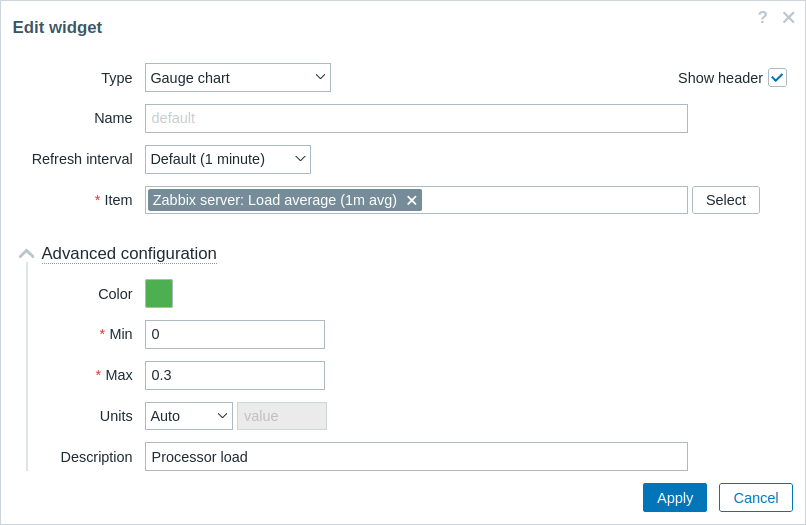
-
Нажмите Apply в форме конфигурации виджета. Затем нажмите Save changes в правом верхнем углу, чтобы сохранить панель.
-
Откройте actions/WidgetView.php и обновите контроллер.
Свойство $this->fields_values теперь содержит значения всех полей Advanced configuration. Завершите настройку контроллера, чтобы передавать конфигурацию и выбранное значение элемента данных в представление виджета.
ui/modules/lesson_gauge_chart/actions/WidgetView.php
<?php

namespace Modules\LessonGaugeChart\Actions;

use API,
    CControllerDashboardWidgetView,
    CControllerResponseData;

class WidgetView extends CControllerDashboardWidgetView {

    protected function doAction(): void {
        $db_items = API::Item()->get([
            'output' => ['itemid', 'value_type', 'name', 'units'],
            'itemids' => $this->fields_values['itemid'],
            'webitems' => true,
            'filter' => [
                'value_type' => [ITEM_VALUE_TYPE_UINT64, ITEM_VALUE_TYPE_FLOAT]
            ]
        ]);

        $history_value = null;

        if ($db_items) {
            $item = $db_items[0];

            $history = API::History()->get([
                'output' => API_OUTPUT_EXTEND,
                'itemids' => $item['itemid'],
                'history' => $item['value_type'],
                'sortfield' => 'clock',
                'sortorder' => ZBX_SORT_DOWN,
                'limit' => 1
            ]);

            if ($history) {
                $history_value = convertUnitsRaw([
                    'value' => $history[0]['value'],
                    'units' => $item['units']
                ]);
            }
        }

        $this->setResponse(new CControllerResponseData([
            'name' => $this->getInput('name', $this->widget->getName()),
            'history' => $history_value,
            'fields_values' => $this->fields_values,
            'user' => [
                'debug_mode' => $this->getDebugMode()
            ]
        ]));
    }
}- Откройте и измените views/widget.view.php.
Вам нужно создать контейнер для диаграммы-датчика, которую вы нарисуете на следующих шагах, и контейнер для описания.
Чтобы передать значения в JavaScript как объект JSON, используйте метод setVar().
ui/modules/lesson_gauge_chart/views/widget.view.php
<?php

/**
 * Gauge chart widget view.
 *
 * @var CView $this
 * @var array $data
 */

(new CWidgetView($data))
    ->addItem([
        (new CDiv())->addClass('chart'),
        $data['fields_values']['description']
            ? (new CDiv($data['fields_values']['description']))->addClass('description')
            : null
    ])
    ->setVar('history', $data['history'])
    ->setVar('fields_values', $data['fields_values'])
->show();-
Создайте новый каталог assets в каталоге lesson_gauge_chart. Этот каталог будет использоваться для хранения JavaScript, CSS и, возможно, других ресурсов, таких как шрифты или изображения.
-
Для JavaScript представления виджета создайте каталог js в каталоге assets.
-
Создайте файл class.widget.js в каталоге assets/js.
Этот JavaScript-класс виджета будет расширять базовый JavaScript-класс всех виджетов панели - CWidget.
Панель зависит от корректной реализации виджета и передает ему всю необходимую информацию через вызов соответствующих JavaScript-методов. Панель также ожидает, что виджет будет генерировать события при возникновении определенного взаимодействия. Поэтому класс CWidget содержит набор методов с реализацией поведения виджета по умолчанию, которое можно настраивать путем расширения класса.
В данном случае требуется некоторая настройка, поэтому пользовательская логика будет реализована для следующего поведения виджета:
- инициализация виджета, отвечающая за определение начального состояния виджета (см. метод onInitialize());
- отображение содержимого виджета (то есть отрисовка диаграммы-датчика), если процесс обновления виджета завершился успешно и без ошибок (см. метод processUpdateResponse(response) и связанные с ним методы _resizeChart() и _updatedChart())
- изменение размера виджета (см. метод onResize() и связанный с ним метод _resizeChart())
Для остальных аспектов виджета диаграммы-датчика будет использоваться реализация поведения виджета по умолчанию. Подробнее о JavaScript-методах класса CWidget см.: JavaScript.
Поскольку этот JavaScript требуется для представления виджета, он должен загружаться вместе со страницей панели. Чтобы включить загрузку JavaScript, необходимо обновить параметры assets/js и js_class в файле manifest.json, как показано в шаге 10.
ui/modules/lesson_gauge_chart/assets/js/class.widget.js
class WidgetLessonGaugeChart extends CWidget {

    static UNIT_AUTO = 0;
    static UNIT_STATIC = 1;

    onInitialize() {
        super.onInitialize();

        this._refresh_frame = null;
        this._chart_container = null;
        this._canvas = null;
        this._chart_color = null;
        this._min = null;
        this._max = null;
        this._value = null;
        this._last_value = null;
        this._units = '';
    }

    processUpdateResponse(response) {
        if (response.history === null) {
            this._value = null;
            this._units = '';
        }
        else {
            this._value = Number(response.history.value);
            this._units = response.fields_values.value_units == WidgetLessonGaugeChart.UNIT_AUTO
                ? response.history.units
                : response.fields_values.value_static_units;
        }

        this._chart_color = response.fields_values.chart_color;
        this._min = Number(response.fields_values.value_min);
        this._max = Number(response.fields_values.value_max);

        super.processUpdateResponse(response);
    }

    setContents(response) {
        if (this._canvas === null) {
            super.setContents(response);

            this._chart_container = this._body.querySelector('.chart');
            this._chart_container.style.height =
                `${this._getContentsSize().height - this._body.querySelector('.description').clientHeight}px`;
            this._canvas = document.createElement('canvas');

            this._chart_container.appendChild(this._canvas);

            this._resizeChart();
        }

        this._updatedChart();
    }

    onResize() {
        super.onResize();

        if (this._state === WIDGET_STATE_ACTIVE) {
            this._resizeChart();
        }
    }

    _resizeChart() {
        const ctx = this._canvas.getContext('2d');
        const dpr = window.devicePixelRatio;

        this._canvas.style.display = 'none';
        const size = Math.min(this._chart_container.offsetWidth, this._chart_container.offsetHeight);
        this._canvas.style.display = '';

        this._canvas.width = size * dpr;
        this._canvas.height = size * dpr;

        ctx.scale(dpr, dpr);

        this._canvas.style.width = `${size}px`;
        this._canvas.style.height = `${size}px`;

        this._refresh_frame = null;

        this._updatedChart();
    }

    _updatedChart() {
        if (this._last_value === null) {
            this._last_value = this._min;
        }

        const start_time = Date.now();
        const end_time = start_time + 400;

        const animate = () => {
            const time = Date.now();

            if (time <= end_time) {
                const progress = (time - start_time) / (end_time - start_time);
                const smooth_progress = 0.5 + Math.sin(Math.PI * (progress - 0.5)) / 2;
                let value = this._value !== null ? this._value : this._min;
                value = (this._last_value + (value - this._last_value) * smooth_progress - this._min) / (this._max - this._min);

                const ctx = this._canvas.getContext('2d');
                const size = this._canvas.width;
                const char_weight = size / 12;
                const char_shadow = 3;
                const char_x = size / 2;
                const char_y = size / 2;
                const char_radius = (size - char_weight) / 2 - char_shadow;

                const font_ratio = 32 / 100;

                ctx.clearRect(0, 0, size, size);

                ctx.beginPath();
                ctx.shadowBlur = char_shadow;
                ctx.shadowColor = '#bbb';
                ctx.strokeStyle = '#eee';
                ctx.lineWidth = char_weight;
                ctx.lineCap = 'round';
                ctx.arc(char_x, char_y, char_radius, Math.PI * 0.749, Math.PI * 2.251, false);
                ctx.stroke();

                ctx.beginPath();
                ctx.strokeStyle = `#${this._chart_color}`;
                ctx.lineWidth = char_weight - 2;
                ctx.lineCap = 'round';
                ctx.arc(char_x, char_y, char_radius, Math.PI * 0.75,
                    Math.PI * (0.75 + (1.5 * Math.min(1, Math.max(0, value)))), false
                    );
                ctx.stroke();

                ctx.shadowBlur = 2;
                ctx.fillStyle = '#1f2c33';
                ctx.font = `${(char_radius * font_ratio)|0}px Arial`;
                ctx.textAlign = 'center';
                ctx.textBaseline = 'middle';
                ctx.fillText(`${this._value !== null ? this._value : t('No data')}${this._units}`,
                    char_x, char_y, size - char_shadow * 4 - char_weight * 2
                );

                ctx.fillStyle = '#768d99';
                ctx.font = `${(char_radius * font_ratio * .5)|0}px Arial`;
                ctx.textBaseline = 'top';

                ctx.textAlign = 'left';
                ctx.fillText(`${this._min}${this._min != '' ? this._units : ''}`,
                    char_weight * .75, size - char_weight * 1.25, size / 2 - char_weight
                );

                ctx.textAlign = 'right';
                ctx.fillText(`${this._max}${this._max != '' ? this._units : ''}`,
                    size - char_weight * .75, size - char_weight * 1.25, size / 2 - char_weight
                );

                requestAnimationFrame(animate);
            }
            else {
                this._last_value = this._value;
            }
        };

        requestAnimationFrame(animate);
    }
}- Откройте manifest.json и добавьте:
- имя файла (class.widget.js) в массив в разделе assets/js;
- имя класса (WidgetLessonGaugeChart) в параметр js_class в разделе widget.
Теперь класс WidgetLessonGaugeChart будет автоматически загружаться вместе с панелью.
ui/modules/lesson_gauge_chart/manifest.json
{
    "manifest_version": 2.0,
    "id": "lesson_gauge_chart",
    "type": "widget",
    "name": "Gauge chart",
    "namespace": "LessonGaugeChart",
    "version": "1.0",
    "author": "Zabbix",
    "actions": {
        "widget.lesson_gauge_chart.view": {
            "class": "WidgetView"
        }
    },
    "widget": {
        "js_class": "WidgetLessonGaugeChart"
    },
    "assets": {
        "js": ["class.widget.js"]
    }
}
Добавление стилей CSS в виджет
В этом разделе вы узнаете, как добавлять собственные стили CSS, чтобы виджет выглядел более привлекательно.
-
Для стилей виджетов создайте новый каталог css в каталоге assets.
-
Создайте файл widget.css в каталоге assets/css. Чтобы стилизовать элементы виджета, используйте селектор div.dashboard-widget-{widget id}. Чтобы настроить CSS для всего виджета, используйте селектор form.dashboard-widget-{idget id}
ui/modules/lesson_gauge_chart/assets/css/widget.css
div.dashboard-widget-lesson_gauge_chart {
    display: grid;
    grid-template-rows: 1fr;
    padding: 0;
}

div.dashboard-widget-lesson_gauge_chart .chart {
    display: grid;
    align-items: center;
    justify-items: center;
}

div.dashboard-widget-lesson_gauge_chart .chart canvas {
    background: white;
}

div.dashboard-widget-lesson_gauge_chart .description {
    padding-bottom: 8px;
    font-size: 1.750em;
    line-height: 1.2;
    text-align: center;
}

.dashboard-grid-widget-hidden-header div.dashboard-widget-lesson_gauge_chart .chart {
    margin-top: 8px;
}- Откройте manifest.json и добавьте имя файла CSS (widget.css) в массив в разделе assets/css. Это позволит стилям CSS, определенным в widget.css, загружаться вместе со страницей панели.
ui/modules/lesson_gauge_chart/manifest.json
{
    "manifest_version": 2.0,
    "id": "lesson_gauge_chart",
    "type": "widget",
    "name": "Gauge chart",
    "namespace": "LessonGaugeChart",
    "version": "1.0",
    "author": "Zabbix",
    "actions": {
        "widget.lesson_gauge_chart.view": {
            "class": "WidgetView"
        }
    },
    "widget": {
        "js_class": "WidgetLessonGaugeChart"
    },
    "assets": {
        "css": ["widget.css"],
        "js": ["class.widget.js"]
    }
}- Обновите страницу панели, чтобы увидеть готовую версию виджета.