
9 Maps
Overview
In the Monitoring → Maps section any configured network map can be viewed.
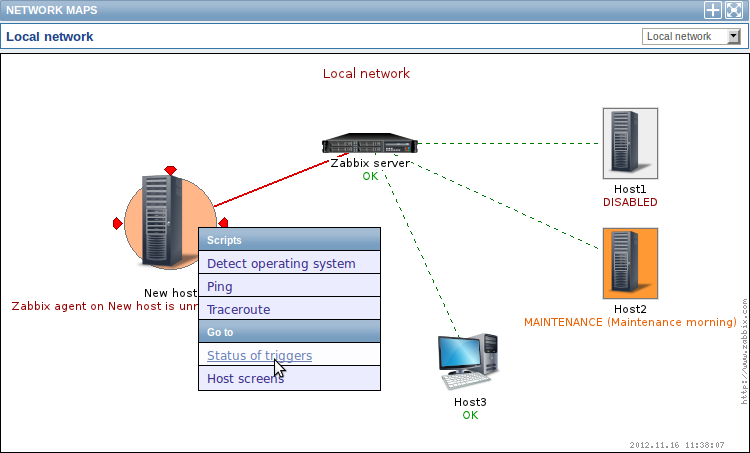
You can use the dropdown in the map title bar to switch between different configured maps.
Icon highlighting
If a map element is in problem status, it is highlighted with a round circle. The fill colour of the circle corresponds to the severity colour of the problem trigger. If all problems are acknowledged, a thick green border around the circle is displayed.
Additionally, a host in maintenance is highlighted with an orange, filled square and a disabled (not-monitored) host is highlighted with a grey, filled square. Highlighting is displayed if the Icon highlighting check-box is marked in map configuration.
Recent change markers
Inward pointing red triangles around an element indicate a recent trigger status change - one that's happened within the last 30 minutes. These triangles are shown if the Mark elements on trigger status change check-box is marked in map configuration.
Links
Clicking on a map element opens a menu with some available links.
Controls
Two control buttons are available in the title bar:
 -
add map to the favourites widget in the Dashboard
-
add map to the favourites widget in the Dashboard -
use the full browser window to display the map
-
use the full browser window to display the map
Referencing a network map
Network maps can be referenced by both sysmapid and mapname GET
parameters. For example,
http://zabbix/zabbix/maps.php?mapname=Local%20networkwill open the map with that name (Local network).
If both sysmapid (map ID) and mapname (map name) are specified,
mapname has higher priority.