
- 5 What's new in Zabbix 4.4.0
- Zabbix agent 2
- Webhooks in alerting
- TimescaleDB officially supported
- Aggregation functions in graphs
- Dependent item limit raised
- Kerberos authentication
- Live/operational data of problems
- Database monitor may return multiple rows/columns
- Low-level discovery
- Secure autoregistration
- Autoregistration with DNS name
- Longer host names allowed in discovery
- Extended item value preprocessing options
- Host names included in real-time export
- Value types included in real-time export
- New templates
- Internal knowledge base
- Jabber, Ez Texting media types removed
- Export/import
- Media type export
- Human-readable export files of hosts/templates
- Frontend
- Default dashboard
- Bar graphs
- Multi-select field for selecting graph items
- 24 column grid in dashboard
- Instant editing for dashboard widgets
- Hiding widget headers
- Dashboard usability
- Problems by severity widget extended
- New host availability widget
- New graph prototype widget
- Cannot support audio notification notice
- Monospaced fonts in trigger expression/command fields
- Longer input fields
- Separate proxy columns
- Macros
- Performance
5 What's new in Zabbix 4.4.0
Zabbix agent 2
A new-generation Zabbix agent has been developed called Zabbix agent 2. Some of the goals set when developing the new agent 2 were to:
- reduce the number of TCP connections
- have greater check concurrency
- be easily extendible with plugins
- be a drop-in replacement for Zabbix agent (in that it supports all the previous functionality)
Agent 2 is written in Go (with some C code of Zabbix agent reused). A configured Go version 1.12+ environment is required for building Zabbix agent 2.
Zabbix agent 2 is available in pre-compiled Zabbix packages. To compile
Zabbix agent 2 from sources you have to specify the --enable-agent2
configure option.
Agent 2 is currently supported for the Linux platform only; with support for a Windows agent on its way. Currently Agent 2 is in experimental status, with a production-ready status expected in the next major release.
See also: Zabbix agent 2
Webhooks in alerting
In the new version you may write your own JavaScript code to extend Zabbix alerting capabilities. While in previous versions that could only be done by some external scripts, now all the alerting logic can be kept inside Zabbix, more specifically, using the new Webhook media type.
A webhook may be used for easy integration of Zabbix alerting with a third-party helpdesk system, chat, messenger, etc. Moreover, it is possible to return some data about created tickets that's then displayed in Zabbix.
TimescaleDB officially supported
Support for TimescaleDB, first added on experimental basis in Zabbix 4.2, is now official. See also: Migration to TimescaleDB
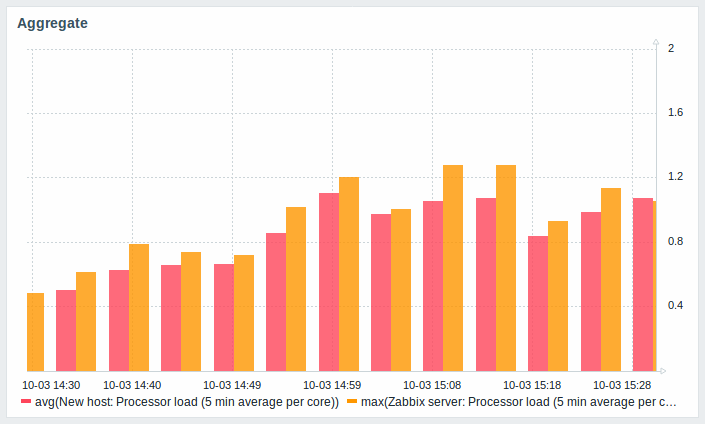
Aggregation functions in graphs
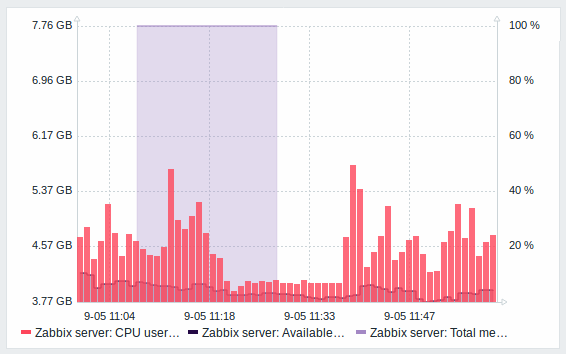
Along with data display in graphs as bars, the new version also introduces the possibility of creating data aggregations in a graph.
So you can select the desired period (5 minutes, an hour, a day) and then display an aggregated value for this period, instead of all values. The aggregation options are as follows:
- min
- max
- avg
- count
- sum
- first (first value displayed)
- last (last value displayed)
The most exciting use of data aggregation is the possibility to create nice side-by-side comparisons of data for some period:
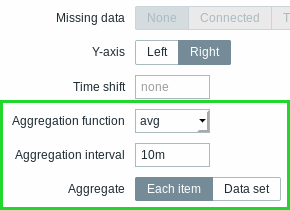
Aggregation can be configured in the data set settings when configuring a graph widget.
You may pick the aggregation function and the time interval. Since a data set may comprise several items, there is also another option allowing to show aggregated data for each item separately or for all data set items as one aggregated value:
See also: Aggregation in graphs
Dependent item limit raised
The maximum number of allowed dependent items for one master item has been raised from 999 to 29999.
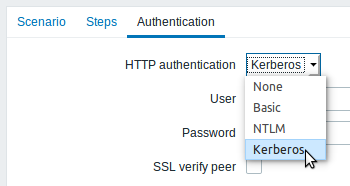
Kerberos authentication
Kerberos authentication is now supported in:
Live/operational data of problems
It is now possible to configure ways of displaying operational data for current problems, i.e. the latest item values as opposed to the item values at the time of the problem.
Operational data display can be configured in the filter of Monitoring → Problems or in the configuration of the respective dashboard widget, by selecting one of the three options:
- None - no operational data is displayed
- Separately - operational data is displayed in a separate column (in this case it replaces the Latest values column from the previous version)
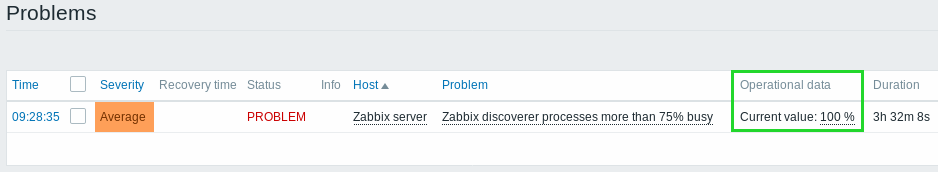
- With problem name - operational data is appended to the problem name and in parentheses
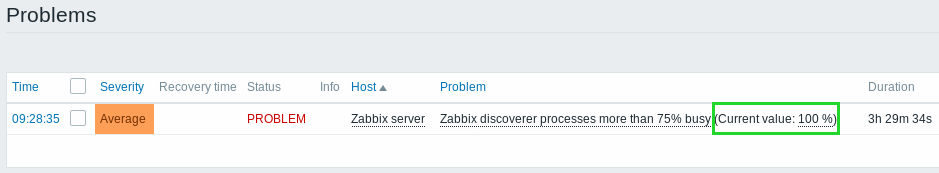
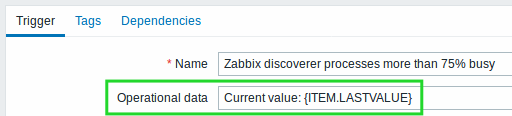
The content of operational data can be configured with each trigger that now has a new Operational data field. This field accepts an arbitrary string with macros, most importantly, the {ITEM.LASTVALUE<1-9>} macro.
Operational data can also be included in notifications using the new {EVENT.OPDATA} macro.
Database monitor may return multiple rows/columns
A new database monitor item has been added:
db.odbc.get[unique_description,data_source_name]Compared to the db.odbc.select[] item that has already been available
in previous versions, the new item is capable of returning values from
multiple rows and columns, formatted as JSON.
Thus it may be used as a master item gathering all required metrics in one system call. JSONPath preprocessing can be used in dependent items to extract individual values from this master item.
The new item may also be used for low-level discovery using ODBC SQL queries.
Compared to the db.odbc.discovery[] item from previous versions, this
item does not define low-level discovery macros in the returned JSON,
however, these macros can be defined by the user as required, using the
custom LLD macro
functionality with JSONPath to point to the required values in the
returned JSON.
Low-level discovery
Low-level discovery of block devices
Low-level discovery of block devices and their type is supported using a new built-in discovery key:
vfs.dev.discoveryThe discovery will return a JSON with the values of two macros - {#DEVNAME} and {#DEVTYPE}, identifying the block device name and type respectively.
These macros can be used to create item prototypes using the
vfs.dev.read[] and vfs.dev.write[] agent items, i.e.
vfs.dev.read[{#DEVNAME},sps]. See also: Discovery of block
devices.
Low-level discovery of systemd services
Low-level discovery of systemd units (services, by default) is supported using a new built-in discovery key:
systemd.unit.discoveryThis item key is only supported in Zabbix agent 2.
The discovery will return a JSON with the values of several macros,
identifying various systemd unit properties. These macros can be used to
create item prototypes using the new systemd.unit.info[] item key, for
example systemd.unit.info["{#UNIT.NAME}",LoadState].
See also:
- Discovery of systemd services
- Zabbix agent items (new item keys)
JMX MBean discovery with non-ASCII characters
There is now a new item for JMX MBean discovery that does not generate low-level discovery macros and therefore can return values without the limitations associated with LLD macro name generation (for example, hyphens, square brackets and non-ASCII characters):
jmx.get[<discovery_mode>,<object_name>]The jmx.discovery[] item from previous versions, if it encountered JMX
MBean properties that could not be converted into a macro name (because
of characters not supported in LLD macro name generation), had to ignore
these properties.
The new jmx.get[] item does not generate LLD macro names in the
returned JSON. Instead, LLD macro names may be defined in the custom
macro tab of a discovery rule, using JSONPath for pointing to the
required values.
See also: Discovery of JMX objects
WMI discovery
A new Windows agent item has been added:
wmi.getall[<namespace>,<query>]Compared to the wmi.get[] item that has already been available in
previous versions, the new item is capable of returning the entire
response of the query, formatted as JSON. JSONPath
preprocessing can
be used to point to more specific values in the returned JSON.
The new item may be used for low-level discovery using WMI queries.
Even though this item does not define low-level discovery macros in the returned JSON, the macros can be defined by the user as required, using the custom LLD macro functionality with JSONPath to point to the required values in the returned JSON.
Secure autoregistration
Previously all communications during agent autoregistration were performed unencrypted. In the new version a secure way of autoregistration is possible by configuring PSK-based authentication with encrypted connections.
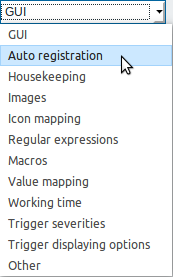
The level of encryption is configured globally in Administration → General, in the new Autoregistration section accessible through the dropdown to the right. It is possible to select no encryption, TLS encryption with PSK authentication or both (so that some hosts may register without encryption while others through encryption):
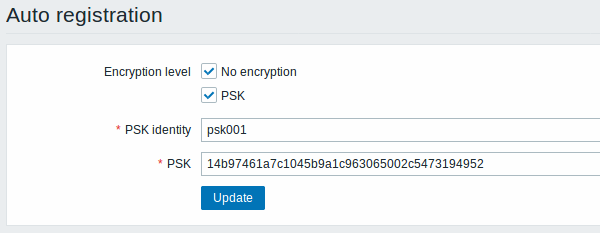
Authentication by PSK is verified by Zabbix server before adding a host. If successful, the host is added and Connections from/to host are set to 'PSK' only with identity/pre-shared key the same as in the global autoregistration setting.
Autoregistration with DNS name
It is now possible to specify that the host should be autoregistered with the DNS name as the default agent interface. To do that, the DNS name should be specified/returned as the value of either 'HostInterface' or 'HostInterfaceItem' configuration parameters. Note that if the value of one of the two parameters changes, the autoregistered host interface is updated. So it is possible to update the default interface to another DNS name or an IP address. For the changes to take effect though, the agent has to be restarted. 'HostInterface' or 'HostInterfaceItem' configuration parameters are supported since Zabbix 4.4.
Longer host names allowed in discovery
Maximum allowed length of a host name has been lifted from 64 characters to 128 characters in host discovery and active agent auto-registration.
Extended item value preprocessing options
CSV to JSON conversion
It is now possible to convert CSV file data into JSON format.
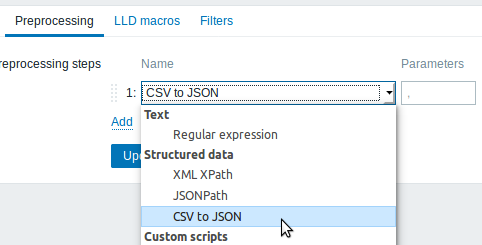
See also: CSV to JSON preprocessing
Custom error handling
Custom error handling is now also available for the following preprocessing steps:
 * Check for error in JSON
 * Check for error in XML
 * Check for error using regular expression
The Custom on fail checkbox is available in these preprocessing steps for regular items and item prototypes. For low-level discovery rules the Custom on fail checkbox is made available for 'Check for error in JSON' and 'Check for error in XML' preprocessing steps.
In a typical use case of custom error handling, data can be skipped if an error message is found.
More options for LLD rule preprocessing
More preprocessing options have been added to low-level discovery rules:
- XML Xpath
- CSV to JSON (new in 4.4)
- Check for error in XML
Host names included in real-time export
Host names are now included in the real-time export of events, item values and trends (previously only the visible host name was exported). Note that the export protocol has changed with host name information now an object, rather than a string/array.
Value types included in real-time export
Value types are now included in the real-time export of item values and trends. See the export protocol for more details.
New templates
New official templates are available for monitoring:
Linux
The new Linux monitoring templates come in three flavours:
- Template OS Linux by Zabbix agent, Template OS Linux by Zabbix
agent active - Linux monitored via Zabbix agent (modular)
- depend on Template Module Zabbix agent, which should be imported/updated first
- Template OS Linux by Prom - Linux monitored via node exporter (monolithic)
- Template OS Linux SNMPv2 - Linux monitored via SNMPv2 (modular)
- depends on Template Module Generic SNMPv2, which should be imported/updated first
- depends on Template Module Interfaces SNMPv2, which should be imported/updated first
Windows
- Template OS Windows by Zabbix agent, Template OS Windows by Zabbix agent active - Windows monitored via Zabbix agent. These templates are supported for Windows Server 2008/Vista and above.
Cisco UCS server
- Template Server Cisco UCS SNMPv2 - Cisco UCS server monitoring template
Nginx
- Template App Nginx by Zabbix agent - collects metrics by polling ngx_stub_status_module locally with Zabbix agent (see description);
- Template App Nginx by HTTP - collects metrics by polling ngx_stub_status_module with HTTP agent remotely (see description).
Apache
- Template App Apache by Zabbix agent - collects metrics by polling mod_status locally with Zabbix agent (see description);
- Template App Apache by HTTP - collects metrics by polling mod_status with HTTP agent remotely (see description).
RabbitMQ
- Template App RabbitMQ cluster by Zabbix agent and Template App RabbitMQ node by Zabbix agent - collect metrics by polling RabbitMQ management plugin with Zabbix agent locally;
- Template App RabbitMQ cluster by HTTP and Template App RabbitMQ node by HTTP - collect metrics by polling RabbitMQ management plugin with HTTP agent remotely.
MySQL/MariaDB
- Template DB MySQL by Zabbix agent - see requirements for operating this template.
PostgreSQL
- Template DB PostgreSQL - see requirements for operating this template.
You can get these templates:
- In Configuration → Templates in new installations;
- If you are upgrading from previous versions, you can download the latest templates from the Zabbix Git repository. Then, while in Configuration → Templates you can import them manually into Zabbix. If templates with the same names already exist, the Delete missing options should be checked when importing to achieve a clean import. This way the old items that are no longer in the updated template will be removed (note that it will mean losing history of these old items).
Internal knowledge base
Item and trigger descriptions allow to share knowledge in Zabbix across various users. These descriptions may explain what an item does or what the nature of the problem is. Now it is easier to notice and view this information in latest data and problem screens.
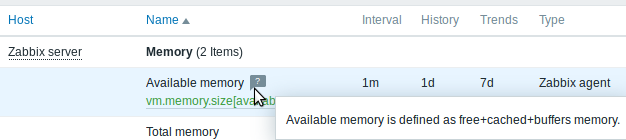
Item description in latest data
Item description now can be viewed in the Latest data section.
An icon with a question mark
![]() is
displayed next to the item name for all items that have a description.
If you position the mouse cursor on this icon, the item description is
displayed as a tooltip.
is
displayed next to the item name for all items that have a description.
If you position the mouse cursor on this icon, the item description is
displayed as a tooltip.
Trigger description for problems
An icon with a question mark
![]() is
displayed next to the problem name for all problems that have a
description. If you position the mouse cursor on this icon, the
description of the underlying trigger is displayed as a tooltip.
is
displayed next to the problem name for all problems that have a
description. If you position the mouse cursor on this icon, the
description of the underlying trigger is displayed as a tooltip.
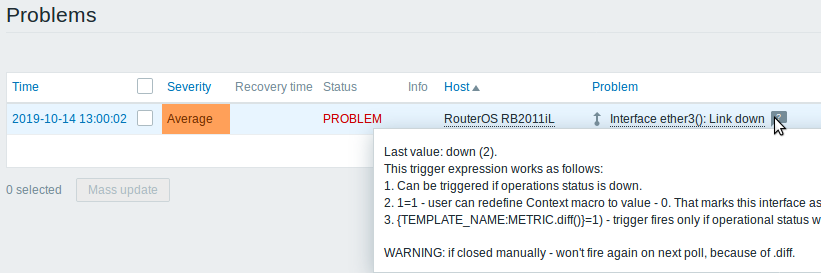
Problem description is also available in event details.
Jabber, Ez Texting media types removed
Jabber and Ez Texting media types for delivering notifications have been removed.
If these media types are present in your existing installation, during the upgrade they will be replaced by a script media type with all relevant parameters preserved. However, notifications via Jabber and Ez Texting will not work any more.
Export/import
Media type export
For easier sharing of media types, including the new webhooks, media types can now be exported and imported.
The export files support the new human-readable format (see below) implemented for host/template export.
Human-readable export files of hosts/templates
Previous implementation of XML/JSON import required the presence of all attributes, even if they were empty or irrelevant. That made the export files extremely long and hardly readable.
In the new version much smaller and simpler export files are produced:
- There is a very limited number of mandatory attributes
- Non-mandatory attributes are exported only if they have a value and the value is different from the default
- Attribute values are now exported in a readable string format, replacing many integers
| < | |||
|---|---|---|---|
| < | |||
See also:
Including triggers within host tags
Previously all triggers in host/template export were listed after the host information. Now, to achieve better readability, triggers that are based on one host item only in problem and recovery expression are listed within the tags of the respective host item.
Additionally the expression tag of these triggers does not reference the
host or item, but only the function ({last()}<>0 in the example):
    <hosts>
        <host>
            <host>Host</host>
            ...
            <items>
                <item>
                    <name>Item</name>
                    <key>item.key</key>
                    ...
                    <triggers>
                        <trigger>
                            <expression>{last()}<>0</expression>
                            <name>Item value not 0</name>
                        </trigger>
                    </triggers>
                </item>
            </items>
        </host>
    </hosts>
The same change affects simple trigger prototypes that are placed under <item_prototype><trigger_prototypes>.
However, triggers that are more complex and contain several host items are listed within separate <triggers> tags, as before.
Frontend
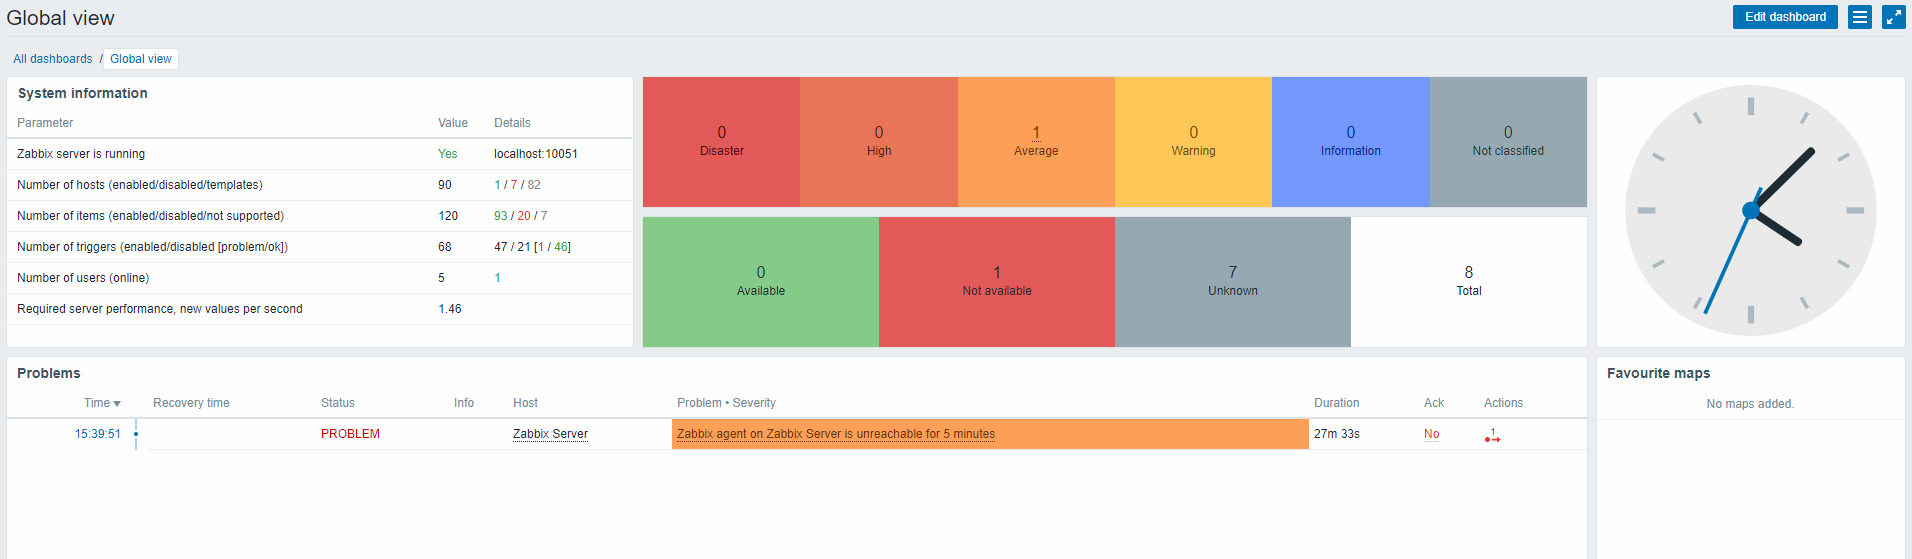
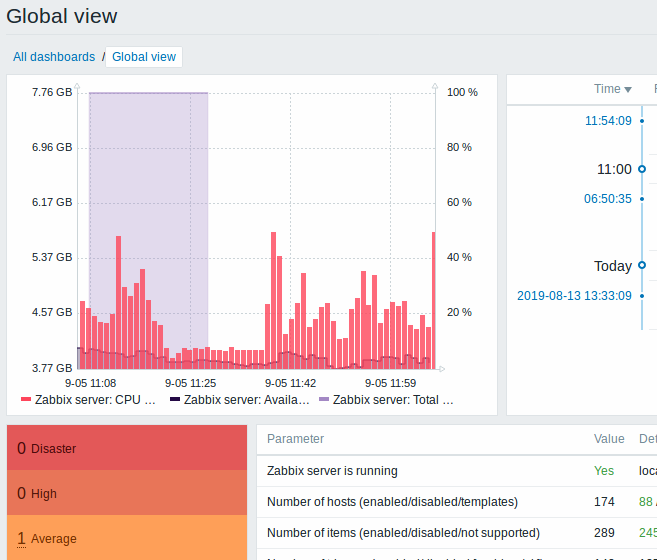
Default dashboard
The default dashboard shipped with new installations (Global view) has been improved:
- An aggregated view of problems has been added with the updated Problems by severity widget
- The new Host availability widget has been added
- Several widgets now have hidden headers including the Clock widget
Bar graphs
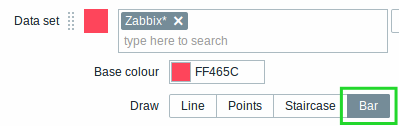
Graph values in the graph widget can now be displayed as bars.
To display values as bars, when configuring the data set of the graph, select Bar as the draw option:
Multi-select field for selecting graph items
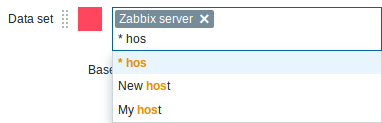
Previously multiple item selection in the new graph widget (introduced in Zabbix 4.0) worked by separating the items with a comma. That created a limitation for selecting items already having a comma, a legitimate symbol, in the name.
To lift this limitation, in the new version, both host and item selection is implemented as multi-select fields where a comma is no longer needed as a separator. The functionality to specify host/item names with a wildcard is also retained. To specify a name with wildcard, just enter the string manually and press Enter. While you are typing, note how all matching entities are displayed in the dropdown.
24 column grid in dashboard
The horizontal limit of allowed dashboard widgets has been raised from 12 to 24 columns.
Instant editing for dashboard widgets
Dashboard widget editing can now be accessed with one mouse click.
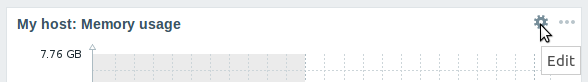
Once the editing button is clicked, the widget editing form is opened and the whole dashboard goes into editing mode.
Hiding widget headers
To use dashboard space more efficiently, a possibility to hide widget headers has been added, allowing to show more content in the widgets. This setting can be configured individually for each widget in their configuration (the Show headers checkbox). If the headers are set to be hidden, they'll still appear on widget focusing by mouse or keyboard.
Dashboard usability
- The widget editing experience has been improved. Several fixes have been made related to better widget focusing while in the edit mode, more usable widget resizing and repositioning.
- The last widget type is now remembered - when adding a new widget to the dashboard, its type is selected based on the widget that was last selected.
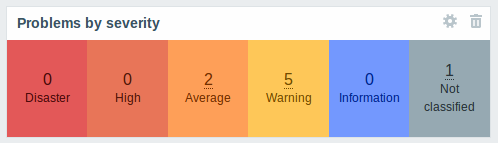
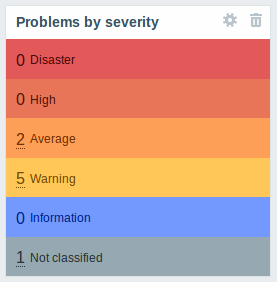
Problems by severity widget extended
The Problems by severity widget has been extended with the option to show problem totals for multiple selected host groups and hosts:
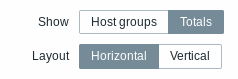
The totals can be displayed in horizontally or vertically stacked blocks:
New host availability widget
A new host availability widget has been added to available dashboard widgets. This widget is similar as the Host info screen element and displays high-level statistics of host availability based on the selected host groups.
The availability statistics can be displayed in horizontally or vertically stacked blocks:
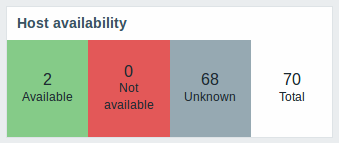
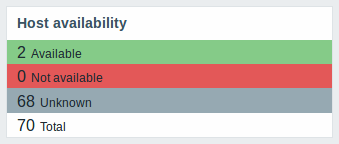
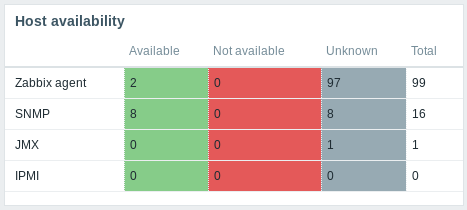
In this widget it is also possible to separately display host availability statistics for any number of host interface types (Zabbix agent, SNMP, JMX, IPMI).
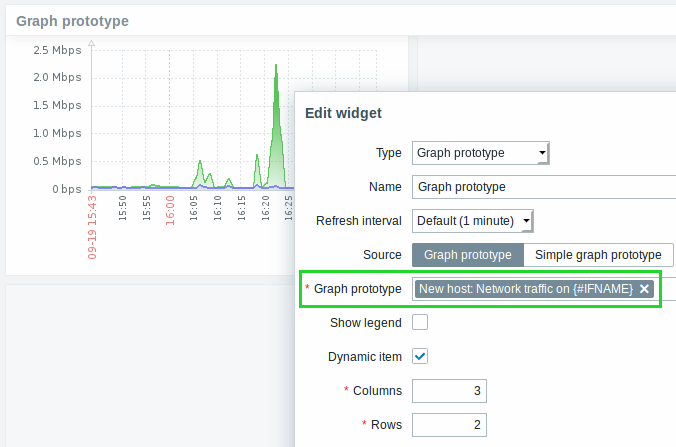
New graph prototype widget
A new graph prototype widget has been added to the dashboard. In it you can display a grid of one or more graphs created from a single graph prototype by low-level discovery.
Cannot support audio notification notice
“Cannot support notification audio for this device.” message will be displayed when notification sounds on the device cannot be played.
Monospaced fonts in trigger expression/command fields
For better readability, text area fonts have been changed to monospace in the following locations:
- Trigger expression and recovery expression field
- Executed script field of SSH/Telnet agent items
- Formula field of calculated items
- SQL query field of database monitor items
- Command field of global scripts
- Remote command field in action configuration

Longer input fields
Input fields that potentially may hold long names or values have been increased to 300 pixels and are also increasing dynamically to a new line when typing:
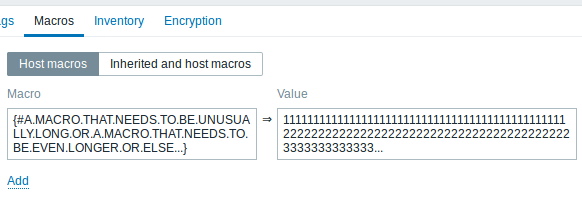
This change has been implemented in:
- Host and template configuration forms (tags and macros)
- Trigger and trigger prototype configuration forms (tags)
- Host, template and trigger mass update forms (tags)
- Low-level discovery rule configuration form (LLD macros)
- Administration → General → Macros
- Item, item prototype and LLD rule configuration forms (test item preprocessing)
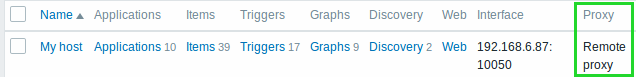
Separate proxy columns
Proxy information has been split into a separate column in several places in the frontend:
- the host list in Configuration → Hosts
- the discovery rule list in Configuration → Discovery
- Administration → Queue (with Details selected in the dropdown)
So, for example, if previously host names of the hosts monitored by a proxy were prefixed with the proxy name, now the proxy name is listed in a separate column.
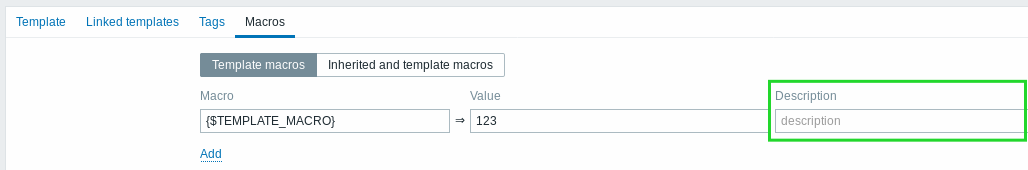
Macros
- {EVENT.ID} is now supported in trigger URLs, allowing to construct complete URLs to problem details.
- It is now possible to add a description to user macros:
Performance
Items table split
The items table was previously used by both frontend and the server,
resulting in undesirable locking of rows at times when, for example, the
server would update fields related to 'log' items. To resolve this
situation, realtime fields (lastlogsize, state, mtime, error)
have been split into a separate table called item_rtdata.