
4 Web
Overview
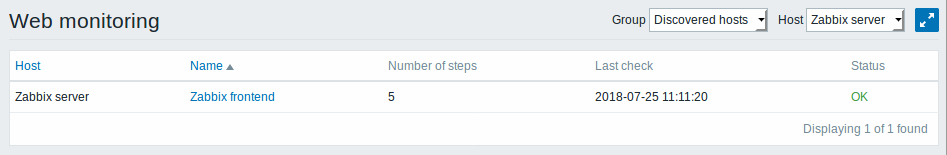
In the Monitoring → Web section current information about web scenarios is displayed.
Note: The name of a disabled host is displayed in red (in both the host dropdown and the list). Data of disabled hosts is accessible starting with Zabbix 2.2.0.
Only values that fall within the last 24 hours are displayed by default. This limit has been introduced with the aim of improving initial loading times for large pages of web monitoring. It is also possible to change this limitation by changing the value of ZBX_HISTORY_PERIOD constant in include/defines.inc.php.
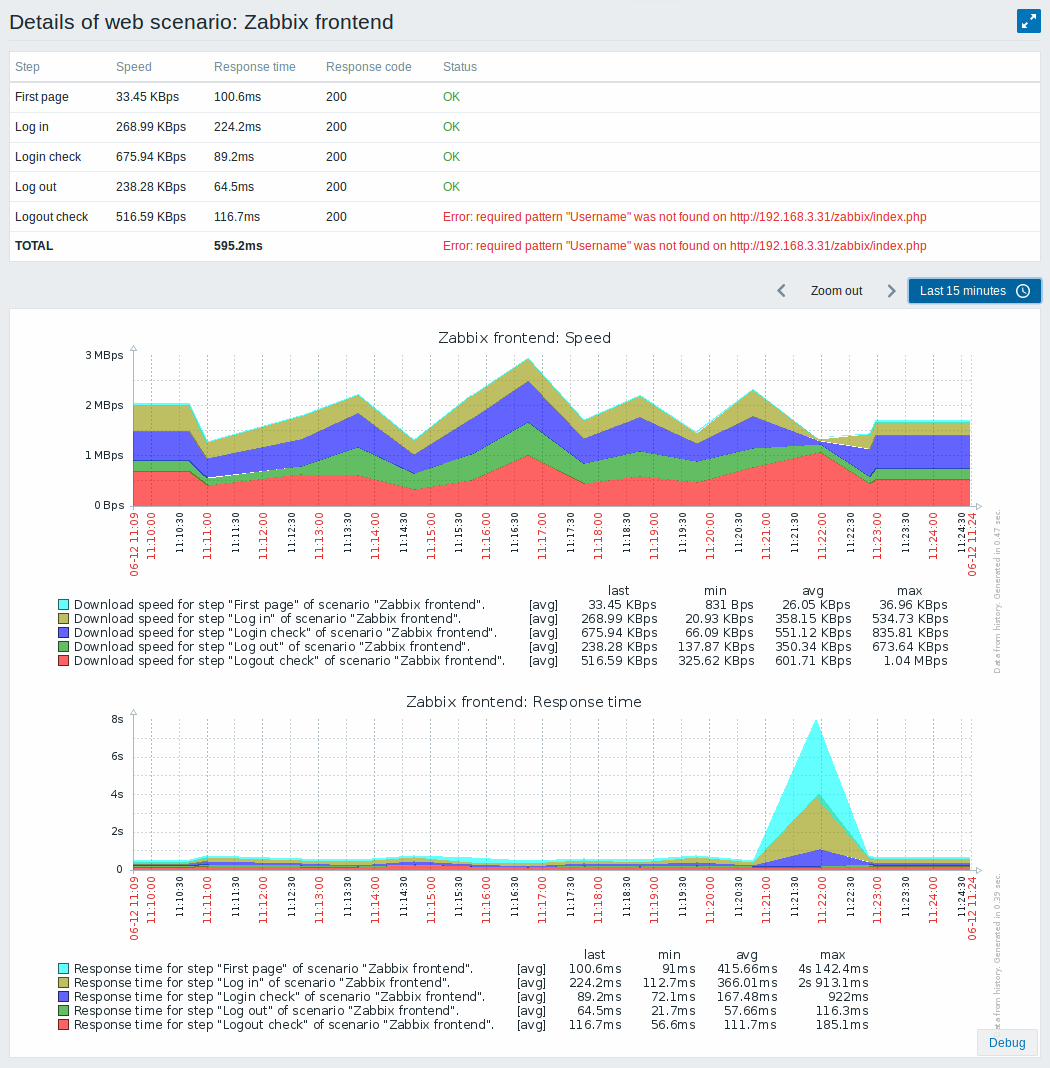
The scenario name is link to more detailed statistics about it:
Buttons
Buttons to the right offer the following options:
 |
Display page in fullscreen mode. |
 |
Display page in kiosk mode. In this mode only page content displayed. The kiosk mode button appears when the fullscreen mode is activated. To exit kiosk mode, move the mouse cursor until the  exit button appears and click on it. Note that you will be taken back to normal mode (not fullscreen mode). exit button appears and click on it. Note that you will be taken back to normal mode (not fullscreen mode). |