11. Maintenance
Overview
You can define maintenance periods for host groups, hosts and specific triggers/services in Zabbix.
There are two maintenance types - with data collection and with no data collection.
During a maintenance "with data collection" triggers are processed as usual and events are created when required. However, problem escalations are paused for hosts/triggers in maintenance, if the Pause operations for suppressed problems option is checked in action configuration. In this case, escalation steps that may include sending notifications or remote commands will be ignored for as long as the maintenance period lasts. Note that problem recovery and update operations are not suppressed during maintenance, only escalations.
For example, if escalation steps are scheduled at 0, 30 and 60 minutes after a problem start, and there is a half-hour long maintenance lasting from 10 minutes to 40 minutes after a real problem arises, steps two and three will be executed a half-hour later, or at 60 minutes and 90 minutes (providing the problem still exists). Similarly, if a problem arises during the maintenance, the escalation will start after the maintenance.
To receive problem notifications during the maintenance normally (without delay), you have to uncheck the Pause operations for suppressed problems option in action configuration.
If at least one host (used in the trigger expression) is not in maintenance mode, Zabbix will send a problem notification.
Zabbix server must be running during maintenance. Timer processes are responsible for switching host status to/from maintenance at 0 seconds of every minute. Note that when a host enters maintenance, Zabbix server timer processes will read all open problems to check if it is required to suppress those. This may have a performance impact if there are many open problems. Zabbix server will also read all open problems upon startup, even if there are no maintenances configured at the time.
A proxy will always collect data regardless of the maintenance type (including "no data" maintenance). The data is later ignored by the server if 'no data collection' is set.
When "no data" maintenance ends, triggers using nodata() function will not fire before the next check during the period they are checking.
If a log item is added while a host is in maintenance and the maintenance ends, only new logfile entries since the end of the maintenance will be gathered.
If a timestamped value is sent for a host that is in a “no data” maintenance type (e.g. using Zabbix sender) then this value will be dropped however it is possible to send a timestamped value in for an expired maintenance period and it will be accepted.
To ensure predictable behaviour of recurring maintenance periods (daily, weekly, monthly), it is required to use a common timezone for all parts of Zabbix.
If maintenance period, hosts, groups or tags are changed by user, the changes will only take effect after configuration cache synchronization.
Configuration
To configure a maintenance period:
- Go to: Configuration → Maintenance
- Click on Create maintenance period (or on the name of an existing maintenance period)
The Maintenance tab contains general maintenance period attributes:
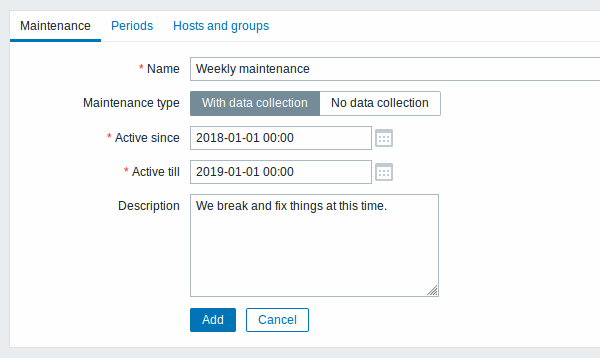
All mandatory input fields are marked with a red asterisk.
| Parameter | Description |
|---|---|
| Name | Name of the maintenance period. |
| Maintenance type | Two types of maintenance can be set: With data collection - data will be collected by the server during maintenance, triggers will be processed No data collection - data will not be collected by the server during maintenance |
| Active since | The date and time when executing maintenance periods becomes active. Note: Setting this time alone does not activate a maintenance period; for that go to the Periods tab. |
| Active till | The date and time when executing maintenance periods stops being active. |
| Description | Description of maintenance period. |
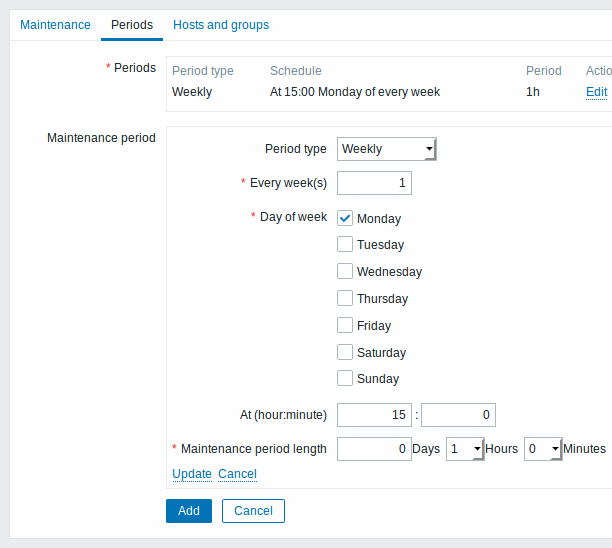
The Periods tab allows you to define the exact days and hours when the maintenance takes place. Clicking on New opens a flexible Maintenance period form where you can define the times - for daily, weekly, monthly or one-time maintenance.
Notes:
- Daily and weekly periods have an Every day/Every week parameter,
which defaults to '1'. Setting it to '2' would make the maintenance
take place every two days or every two weeks and so on. In this case
the starting day or week is the day/week that the Active since
time falls on. For example:
- with Active since set to January 1st at 12:00 and a one-hour maintenance set for every two days at 11pm will result in the first maintenance period starting on January 1st at 11pm, while the second maintenance period will start on January 3rd at 11pm;
- with the same Active since time and a one-hour maintenance set for every two days at 1am, the first maintenance period will start on January 3rd at 1am, while the second maintenance period will start on January 5th at 1am.
- Since Zabbix 4.4.8, Daylight Saving Time (DST) changes do not
affect how long the maintenance will be. Let's say we have a
two-hour maintenance that usually starts at 1am and finishes at 3am:
- If after one hour of maintenance (at 2am) a DST change happens and current time changes from 2:00 to 3:00, the maintenance will continue for one more hour till 4:00;
- If after two hours of maintenance (at 3am) a DST change happens and current time changes from 3:00 to 2:00, the maintenance will stop because two hours have passed.
The Hosts and groups tab allows you to select the host groups, hosts and problem tags for maintenance.
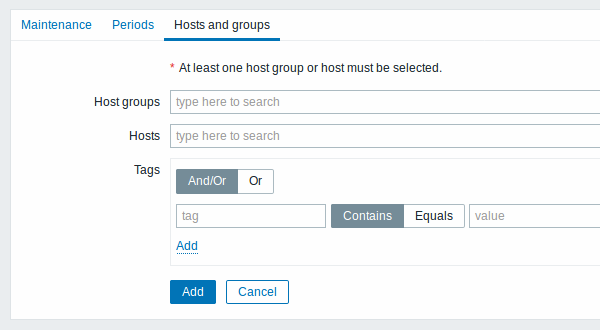
| Parameter | Description |
|---|---|
| Host groups | Select host groups that the maintenance will be activated for. The maintenance will be activated for all hosts from the specified host group(s). This field is auto-complete, so starting to type in it will display a dropdown of all available host groups. Specifying a parent host group implicitly selects all nested host groups. Thus the maintenance will also be activated on hosts from nested groups. |
| Hosts | Select hosts that the maintenance will be activated for. This field is auto-complete, so starting to type in it will display a dropdown of all available hosts. |
| Tags | If maintenance tags are specified, maintenance for the selected hosts will still be activated, but problems will only be suppressed (i.e. no actions will be taken) if their tags are a match. In case of multiple tags, they are calculated as follows: And/Or - all tags must correspond; however tags with the same tag name are calculated by the Or condition Or - enough if one tag corresponds There are two ways of matching the tag value: Contains - case-sensitive substring match (tag value contains the entered string) Equals - case-sensitive string match (tag value equals the entered string) |
Display
Displaying hosts in maintenance
An orange wrench icon
![]() next to the host name indicates that this host is in maintenance in:
next to the host name indicates that this host is in maintenance in:
- Monitoring → Dashboard
- Monitoring → Problems
- Inventory → Hosts → Host inventory details
- Configuration → Hosts (See 'Status' column)
![]()
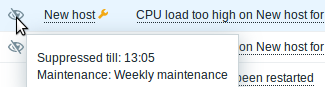
Maintenance details are displayed when the mouse pointer is positioned over the icon.
Additionally, hosts in maintenance get an orange background in Monitoring → Maps.
Displaying suppressed problems
Normally problems for hosts in maintenance are suppressed, i.e. not displayed in the frontend. However, it is also possible to configure that suppressed problems are shown, by selecting the Show suppressed problems option in these locations:
- Monitoring → Dashboard (in Problem hosts, Problems, Problems by severity, Trigger overview widget configuration)
- Monitoring → Problems (in the filter)
- Monitoring → Overview (in the filter; with 'Triggers' as Type)
- Monitoring → Maps (in map configuration)
- Global notifications (in user profile configuration)
When suppressed problems are displayed, the following icon is displayed:
![]() . Rolling a
mouse over the icon displays more details:
. Rolling a
mouse over the icon displays more details: