
3 Screens
Overview
On Zabbix screens you can group information from various sources for a quick overview on a single screen. Building the screens is quite easy and intuitive.
Essentially a screen is a table. You choose how many cells per table and what elements to display in the cells. The following elements can be displayed:
- simple graphs
- simple graph prototypes
- user-defined custom graphs
- custom graph prototypes
- maps
- plain text information
- server information (overview)
- host information (overview)
- trigger information (overview)
- host/host group issues (status of problems)
- problems by severity
- data overview
- clock
- history of events
- history of recent actions
- URL (data taken from another location)
Global screens are managed in Monitoring → Screens, where they can be configured, managed and viewed. They can also be added to the favourites section of Monitoring → Dashboard.
Host-level screens are configured on template level and then generated for hosts once the template is linked to the hosts.
To configure a screen you must first create it by defining its general properties and then add individual elements in the cells.
All users in Zabbix (including non-admin users) can create screens. Screens have an owner - the user who created them.
Screens can be made public or private. Public screens are visible to all users.
Private screens are visible only to their owner. Private screens can be shared by the owner to other users and user groups. Regular (non-Super admin) users can only share with the groups and users they are member of. Private screens will be visible to their owner and the users the screen is shared with as long as they have read permissions to all screen elements. Admin level users, as long as they have read permissions to all screen elements, can see and edit private screens regardless of being the owner or belonging to the shared user list.
For both public and private screens a user must have at least read permissions to all screen elements in order to see the screen. To add an element to a screen a user must also have at least read permission to it.
Creating a screen
To create a screen, do the following:
- Go to Monitoring → Screens
- Go to the view with all screens
- Click on Create Screen
The Screen tab contains general screen attributes:
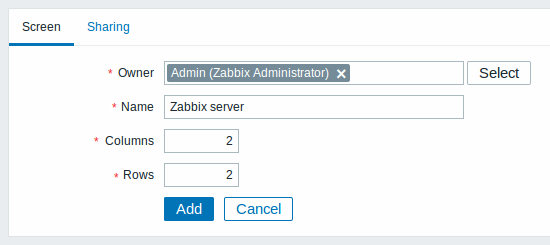
All mandatory input fields are marked with a red asterisk.
Give your screen a unique name and set the number of columns (vertical cells) and rows (horizontal cells).
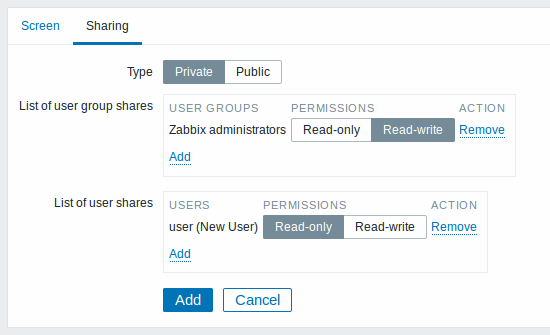
The Sharing tab contains the screen type as well as sharing options (user groups, users) for private screens:
| Parameter | Description |
|---|---|
| Owner | Select the screen owner. |
| Type | Select screen type: Private - screen is visible only to selected user groups and users Public - screen is visible to all |
| List of user group shares | Select user groups that the screen is accessible to. You may allow read-only or read-write access. |
| List of user shares | Select users that the screen is accessible to. You may allow read-only or read-write access. |
Click on Add to save the screen.
Adding elements
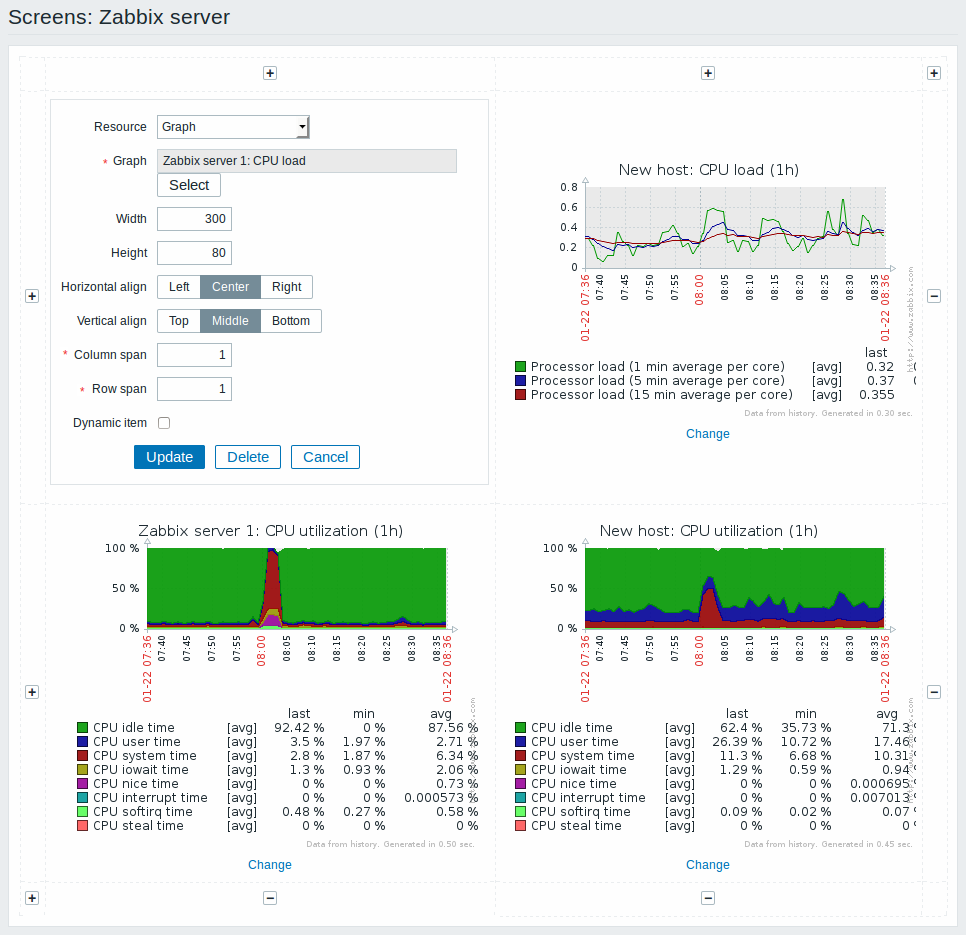
To add elements to the screen, click on Constructor next to the screen name in the list.
On a new screen you probably only see links named Change. Clicking those links opens a form whereby you set what to display in each cell.
On an existing screen you click on the existing elements to open the form whereby you set what to display.
All mandatory input fields are marked with a red asterisk.
Screen element attributes:
| Parameter | Description |
|---|---|
| Resource | Information displayed in the cell: Action log - history of recent actions Clock - digital or analog clock displaying current server or local time Data overview - latest data for a group of hosts Graph - single custom graph Graph prototype - custom graph from low-level discovery rule History of events - latest events Host group issues - status of triggers filtered by the host group (includes triggers without events, since Zabbix 2.2) Host info - high level host related information Host issues - status of triggers filtered by the host (includes triggers without events, since Zabbix 2.2) Map - single map Plain text - plain text data Simple graph - single simple graph Simple graph prototype - simple graph based on item generated by low-level discovery System information - high-level information about Zabbix server Problems by severity - displays problems by severity (similar to the Dashboard) Trigger info - high level trigger related information Trigger overview - status of triggers for a host group URL - include content from the specified resource See also more information on configuring each resource. |
| Horizontal align | Possible values: Center Left Right |
| Vertical align | Possible values: Middle Top Bottom |
| Column span | Extend cell to a number of columns, same way as HTML column spanning works. |
| Row span | Extend cell to a number of rows, same way as HTML row spanning works. |
Take note of the '+' and '-' controls on each side of the table.
Clicking on '+' above the table will add a column. Clicking on '-' beneath the table will remove a column.
Clicking on '+' on the left side of the table will add a row. Clicking on '-' on the right side of the table will remove a row.
If graph height is set as less than 120 pixels, no trigger will be displayed in the legend.
Dynamic elements
For some of the elements there is an extra option called Dynamic item. Checking this box at first does not to seem to change anything.
However, once you go to Monitoring → Screens, you may realize that now you have extra dropdowns there for selecting the host. Thus you have a screen where some elements display the same information while others display information depending on the currently selected host.
The benefit of this is that you do not need to create extra screens just because you want to see the same graphs containing data from various hosts.
Dynamic item option is available for several screen elements:
- Graphs (custom graphs)
- Graph prototypes
- Simple graphs
- Simple graph prototypes
- Plain text
- URL
Clicking on a dynamic graph opens it in full view; although with custom graphs and graph prototypes that is currently supported with the default host only (i.e. with host 'not selected' in the dropdown). When selecting another host in the dropdown, the dynamic graph is created using item data of that host and the resulting graph is not clickable.
Dynamic URL elements will not be displayed in Monitoring → Screens, unless a host is selected. Without a selected host the "No host selected" message will be visible only.