
On this page
5 Action log
Overview
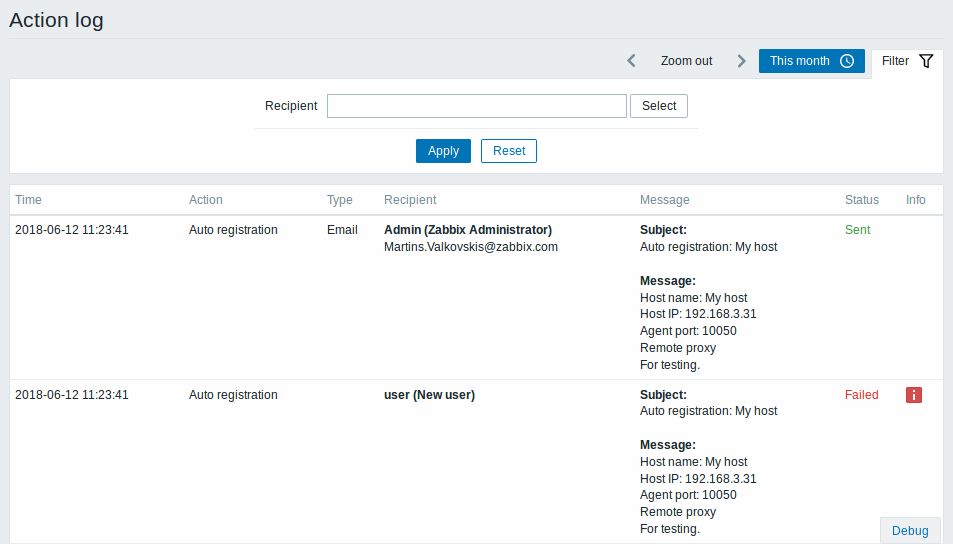
In this screen details of operations (notifications, remote commands) executed within an action are displayed.
Displayed data:
| Column | Description |
|---|---|
| Time | Timestamp of the operation. |
| Action | Name of the action causing operations is displayed. Action name is displayed since Zabbix 2.4.0. |
| Type | Operation type is displayed - Email or Command. |
| Recipient(s) | User alias, name and surname (in parenthesis) and e-mail address of the notification recipient is displayed. User alias, name and surname are displayed since Zabbix 2.4.0. |
| Message | The content of the message/remote command is displayed. A remote command is separated from the target host with a colon symbol: <host>:<command>. If the remote command is executed on Zabbix server, then the information has the following format: Zabbix server:<command> |
| Status | Operation status is displayed: In progress - action is in progress For actions in progress the number of retries left is displayed - the remaining number of times the server will try to send the notification. Sent - notification has been sent Executed - command has been executed Not sent - action has not been completed. |
| Info | Error information (if any) regarding the action execution is displayed. |
Using filter
You may use the filter to narrow down the records by the recipient of e-mail.
The filter is located below the Action log bar. It can be opened and collapsed by clicking on the Filter tab on the left.
Time period selector
The time period selector allows to select often required periods with one mouse click. The time period selector can be opened by clicking on the time period tab next to the filter.