
3 Screens
Overview
On Zabbix screens you can group information from various sources for a quick overview on a single screen. Building the screens is quite easy and intuitive.
Essentially a screen is a table. You choose how many cells per table and what elements to display in the cells. The following elements can be displayed:
- simple graphs
- user-defined custom graphs
- maps
- other screens
- plain text information
- server information (overview)
- hosts information (overview)
- trigger information (overview)
- host/hostgroup issues (status of triggers)
- system status
- data overview
- clock
- history of events
- history of actions
- URL (data taken from another location)
Browsers might not load an HTTP page included in a screen (using URL element), if Zabbix frontend is accessed over HTTPS.
Screens that are ready can be viewed in Monitoring → Screens. They can also be added to the favourites section of the Dashboard.
To configure a screen you must first create it by defining its general properties and then add individual elements in the cells.
Creating a screen
To create a screen, do the following:
- Go to Configuration → Screens
- Click on Create Screen
- Edit general screen attributes
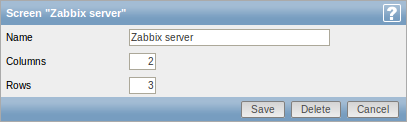
Give your screen a unique name and set the number of columns (vertical cells) and rows (horizontal cells). Click Save.
Now you can click on the screen name in the list to be able to add elements.
Adding elements
On a new screen you probably only see links named Change. Clicking those links opens a form whereby you set what to display in each cell.
On an existing screen you click on the existing elements to open the form whereby you set what to display.
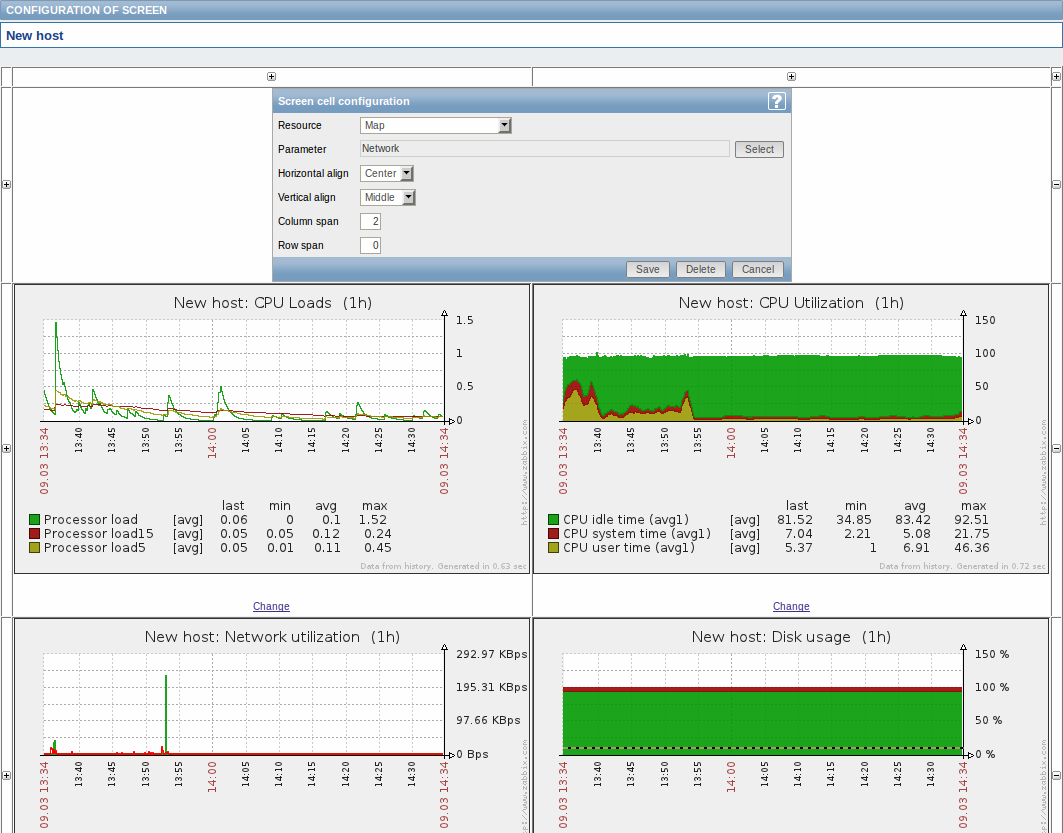
Screen element attributes:
| Parameter | Description |
|---|---|
| Resource | Information displayed in the cell: Clock - digital or analog clock displaying current server or local time. Note: To display host time, use the system.localtime[local] item. This item must exist on the host.Data overview - latest data for a group of hosts Graph - single custom graph History of actions - history of recent actions History of events - latest events Host group issues - status of triggers filtered by the hostgroup (includes triggers without events, since Zabbix 2.2) Host issues - status of triggers filtered by the host (includes triggers without events, since Zabbix 2.2) Hosts info - high level host related information Map - single map Plain text - plain text data Screen - screen (one screen may contain other screens inside) Server info - server high-level information Simple graph - single simple graph System status - displays system status (similar to the Dashboard) Triggers info - high level trigger related information Triggers overview - status of triggers for a host group URL - include content from an external resource |
| Horizontal align | Possible values: Center Left Right |
| Vertical align | Possible values: Middle Top Bottom |
| Column span | Extend cell to a number of columns, same way as HTML column spanning works. |
| Row span | Extend cell to a number of rows, same way as HTML row spanning works. |
Take note of the '+' and '-' controls on each side of the table.
Clicking on '+' above the table will add a column. Clicking on '-' beneath the table will remove a column.
Clicking on '+' on the left side of the table will add a row. Clicking on '-' on the right side of the table will remove a row.
If graph height is set as less than 120 pixels, no trigger will be displayed in the legend.
Dynamic elements
For some of the elements there is an extra option called Dynamic item. Checking this box at first does not to seem to change anything.
However, once you go to Monitoring → Screens, you may realize that now you have extra dropdowns there for selecting the host. Thus you have a screen where some elements display the same information while others display information depending on the currently selected host.
The benefit of this is that you do not need to create extra screens just because you want to see the same graphs containing data from various hosts.
Dynamic item option is available for several screen elements:
- Graphs (custom graphs)
- Simple graphs
- Plain text
Clicking on a dynamic graph opens it in full view; although with custom graphs that is currently supported with the default host only (i.e. with host 'not selected' in the dropdown). When selecting another host in the dropdown, the dynamic graph is created using item data of that host and the resulting graph is not clickable.