
9 What's new in Zabbix 2.2.4
Trigger evaluation order improved for dependencies
To make sure that trigger dependencies work correctly, it is important that the trigger evaluation order works correctly first.
Previously, the evaluation order of triggers was by trigger IDs, which would work fine regarding dependencies as long as the more important trigger was evaluated first. However, in situations where the dependent trigger was evaluated first, dependencies would not work correctly. For example, the dependent trigger would go into a problem state because the more important, root trigger would not have been evaluated and changed to 'Problem' yet. Or, the dependent trigger would not be changed to 'OK', simply because the root trigger would not have been evaluated and changed to 'OK' yet.
To solve this, triggers in dependencies now are always evaluated starting with the most important first. In a "trigger A depends on trigger B that depends on trigger C" dependency, C is now always evaluated before B and before A.
Frontend improvements
Value selection popups are back
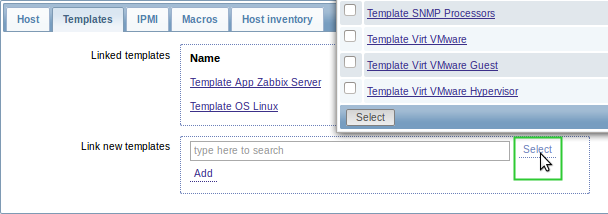
In Zabbix 2.2.0, auto-select fields were introduced to eliminate redundant clicking when trying to select well-known values for a field, for example, when selecting templates for a host. While this made life easier for those who knew the name of the value they were looking for, lost was the ability to browse the whole content of available values, like in a popup-style selection. Selection was also made difficult for users who did not know exactly what they were looking for, or in cases with the same trigger name across very many hosts.
Thus, in Zabbix 2.2.4, popups for value selection are reinstated alongside the auto-select fields:
Latest data from 24 hours only
Only values that fall within the last 24 hours are now displayed in Monitoring → Latest data, Monitoring → Overview and the Data overview screen element by default.
This limit has been introduced with the aim of improving initial loading times for large pages of latest data. It is also possible to change this limitation by changing the value of ZBX_HISTORY_PERIOD constant in include/defines.inc.php.
Updated translations
- Brazilian Portuguese
- German
- Italian
- Japanese
- Polish
- Romanian
- Russian
- Slovak
- Spanish
Daemon improvements
- History cache performance has been improved by using configuration cache more instead of using database.
- Improved handling of log file rotation/truncation for
logrt[]andlog[]items. Special attention is paid to cases when several log files have the same last modification time. For more details see Important notes in the Log file monitoring section. - A log message has been added to the zabbix_server log whenever an unsupported item's reason for being in that state changes.
Miscellaneous improvements
- An example robots.txt file has been added in the frontend.
- Trigger-based events are loaded much quicker and with less memory usage in Monitoring → Events.
- Last event calculation in the System status frontend widget has been optimized, which may result in improved speed and less memory usage in environments with huge numbers of problem triggers and host groups.
- In node-based environments, a duplicating Node column has been removed from trigger popups in the System status frontend widget.