
16 Criando nomes personalizados para contadores de desempenho no VMware
Overview
O caminho do contador de desempenho do VMware tem o
group/counter[rollup] onde:
group- o grupo do contador de desempenho, por exemplo cpucounter- o nome do contador de desempenho, por exemplo usagemhzrollup- o contador de desempenho tipo rollup, por exemplo average
Portanto, o exemplo acima resultaria no seguinte caminho do contador:
cpu/usagemhz[average]
As descrições do contador de desempenho grupo, nomes e tipos rollup podem ser encontrados em documentação VMware.
É possível obter nomes internos e criar nomes personalizados para contadores de desempenho usando o item de script no Zabbix.
Configuração
- Crie um item de script desabilitado no host principal do VMware (onde o item eventlog[] está presente) com os seguintes parâmetros:
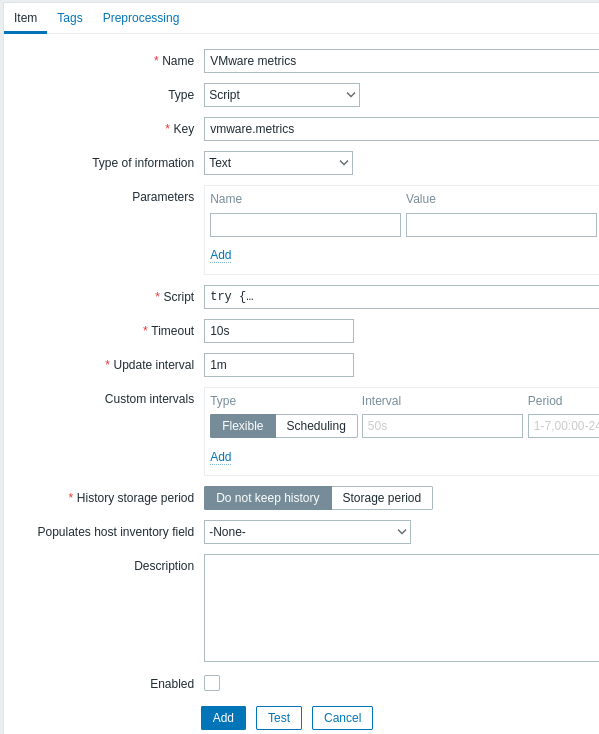
- Nome: VMware metrics
- Tipo: Script
- Key: vmware.metrics
- Tipo de informação: Text
- Script: copie e cole o script fornecido abaixo
- Tempo limite: 10
- Período de armazenamento de histórico: Não manter histórico
- Habilitado: não selecionado
Script
try {
    Zabbix.log(4, 'vmware metrics script');

    var result, resp,
    req = new HttpRequest();
    req.addHeader('Content-Type: application/xml');
    req.addHeader('SOAPAction: "urn:vim25/6.0"');

    login = '<soapenv:Envelope xmlns:soapenv="http://schemas.xmlsoap.org/soap/envelope/" xmlns:urn="urn:vim25">\
    <soapenv:Header/>\
    <soapenv:Body>\
        <urn:Login>\
            <urn:_this type="SessionManager">SessionManager</urn:_this>\
            <urn:userName>{$VMWARE.USERNAME}</urn:userName>\
            <urn:password>{$VMWARE.PASSWORD}</urn:password>\
        </urn:Login>\
    </soapenv:Body>\
</soapenv:Envelope>'
    resp = req.post("{$VMWARE.URL}", login);
    if (req.getStatus() != 200) {
        throw 'Response code: '+req.getStatus();
    }

    query = '<soapenv:Envelope xmlns:soapenv="http://schemas.xmlsoap.org/soap/envelope/" xmlns:urn="urn:vim25">\
<soapenv:Header/>\
    <soapenv:Body>\
        <urn:RetrieveProperties>\
            <urn:_this type="PropertyCollector">propertyCollector</urn:_this>\
            <urn:specSet>\
                <urn:propSet>\
                   <urn:type>PerformanceManager</urn:type>\
                   <urn:pathSet>perfCounter</urn:pathSet>\
                </urn:propSet>\
                <urn:objectSet>\
                   <urn:obj type="PerformanceManager">PerfMgr</urn:obj>\
                </urn:objectSet>\
            </urn:specSet>\
        </urn:RetrieveProperties>\
    </soapenv:Body>\
</soapenv:Envelope>'
    resp = req.post("{$VMWARE.URL}", query);
    if (req.getStatus() != 200) {
        throw 'Response code: '+req.getStatus();
    }
    Zabbix.log(4, 'vmware metrics=' + resp);
    result = resp;

    logout = '<soapenv:Envelope xmlns:soapenv="http://schemas.xmlsoap.org/soap/envelope/" xmlns:urn="urn:vim25">\
    <soapenv:Header/>\
    <soapenv:Body>\
        <urn:Logout>\
            <urn:_this type="SessionManager">SessionManager</urn:_this>\
        </urn:Logout>\
    </soapenv:Body>\
</soapenv:Envelope>'

    resp = req.post("{$VMWARE.URL}",logout);
    if (req.getStatus() != 200) {
        throw 'Response code: '+req.getStatus();
    }

} catch (error) {
    Zabbix.log(4, 'vmware call failed : '+error);
    result = {};
}

return result;
Uma vez que o item está configurado, clique no botão Test, e então clique em Get value.
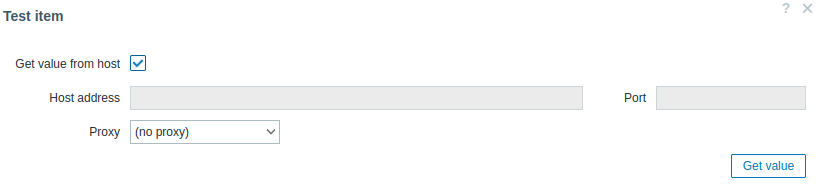
Copie o XML recebido para qualquer formatador de XML e encontre a métrica desejada.
Um exemplo de XML para uma métrica:
<PerfCounterInfo xsi:type="PerfCounterInfo">
    <key>6</key>
    <nameInfo>
        <label>Usage in MHz</label>
        <summary>CPU usage in megahertz during the interval</summary>
        <key>usagemhz</key>
    </nameInfo>
    <groupInfo>
        <label>CPU</label>
        <summary>CPU</summary>
        <key>cpu</key>
    </groupInfo>
    <unitInfo>
        <label>MHz</label>
        <summary>Megahertz</summary>
        <key>megaHertz</key>
    </unitInfo>
    <rollupType>average</rollupType>
    <statsType>rate</statsType>
    <level>1</level>
    <perDeviceLevel>3</perDeviceLevel>
</PerfCounterInfo>
Use o XPath para extrair o caminho do contador do XML recebido. Para o exemplo acima, o XPath será:
| field | xPath | value |
|---|---|---|
| group | //groupInfo[../key=6]/key | cpu |
| counter | //nameInfo[../key=6]/key | usagemhz |
| rollup | //rollupType[../key=6] | average |
O caminho resultante do contador de desempenho neste caso é: cpu/usagemhz[average]