
24 Web 监控
概述
该部件显示活动网页监控场景的状态摘要。
配置
当用户无权访问某些小部件元素时,该元素的名称在小部件配置过程中将显示为Inaccessible。 这将导致显示不可访问的监控项、不可访问的主机、不可访问的组、不可访问的映射和不可访问的图形,而非元素的"真实"名称。
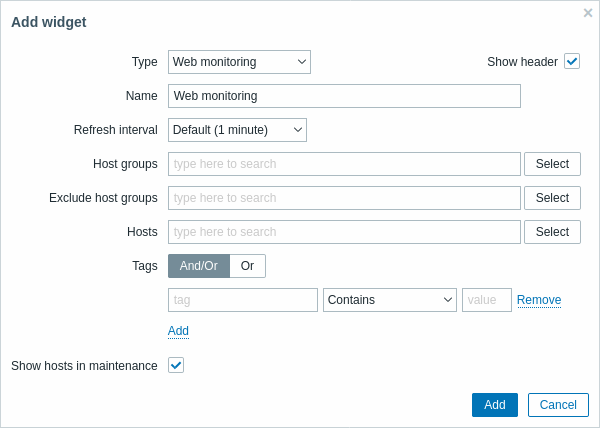
除了适用于所有小部件的通用参数参数外,您还可以设置以下特定选项:
| 主机 组 | 输入要显示在小部件中的主机组。此字段支持自动补全,开始输入组名时将显示匹配组的下拉列表。 指定父级主机组会隐式选择所有嵌套的主机组。 来自这些主机组的主机数据将显示在小部件中。如果未输入任何主机组,则将显示所有主机组。 |
| 排除主机组 | 输入需要在小部件中隐藏的主机组。该字段支持自动补全功能,输入组名时会显示匹配组的下拉列表。 指定父级主机组将隐式选择所有嵌套的主机组。 来自这些主机组的主机数据不会在小部件中显示。例如,主机 001、002、003可能在A组中,而主机 002、003也在B组中。如果我们同时选择显示A组和排除B组,则仪表板中仅会显示来自主机 001的数据。 |
| 主机 | 输入 主机 以在小部件中显示。该字段支持自动补全,因此开始输入 一个主机 名称时将显示匹配 主机 的下拉列表。 如果未输入任何 主机,则将显示所有 主机。 |
| 标签 | 指定标签以限制部件中显示的Web场景数量。可以包含或排除特定标签及其值。可设置多个条件。标签名称匹配始终区分大小写。 每个条件支持以下运算符: 存在 - 包含指定标签名称 等于 - 包含指定标签名称及值(区分大小写) 包含 - 包含标签值含有输入string的指定标签名称(子串匹配,不区分大小写) 不存在 - 排除指定标签名称 不等于 - 排除指定标签名称及值(区分大小写) 不包含 - 排除标签值含有输入string的指定标签名称(子串匹配,不区分大小写) 条件计算类型有两种: 与/或 - 必须满足所有条件,相同标签名的条件将通过或条件分组 或 - 只需满足一个条件 |
| 显示维护中的主机 | 在统计中包含处于维护状态的主机。 |
Web监控部件
完成配置后,您可能希望查看显示数据的部件。 为此,请转到监控 → 仪表板,点击您创建部件的仪表板名称。
在本示例中,您可以看到名为"Zabbix前端"的部件显示了三个主机组的Web监控状态: "内部网络"、"Linux服务器"和"Web服务器"。
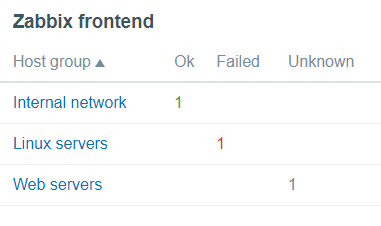
Web监控部件显示以下信息:
-
部件名称;下方有四列:
- 主机组 - 显示包含配置了Web场景的主机的主机组列表;
- 正常 - 当满足以下两个条件时显示Web场景数量(绿色):
-
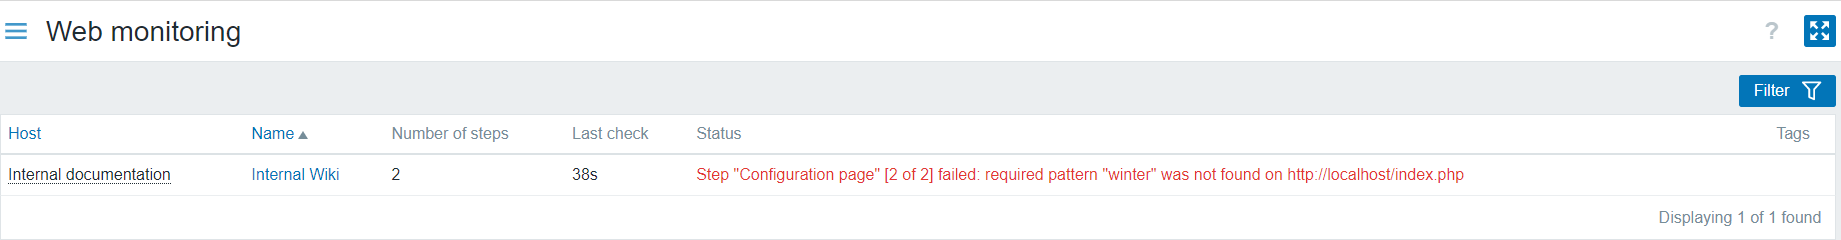
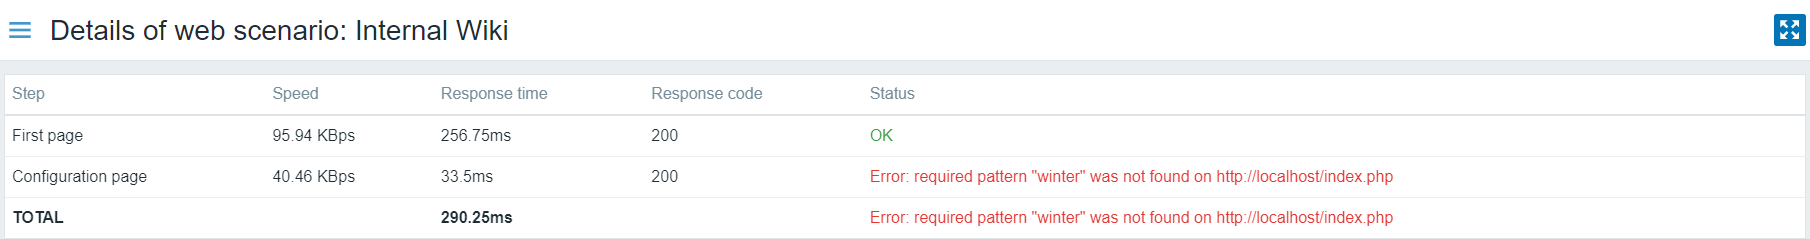
失败 - 显示存在失败步骤的Web场景数量(红色):
- click on the host name, and it will open a new window; the Status column provides detailed information (in red color) on the step where Zabbix failed to collect the data; and also,
- gives a hint for the parameter that has to be corrected in the configuration form.
-
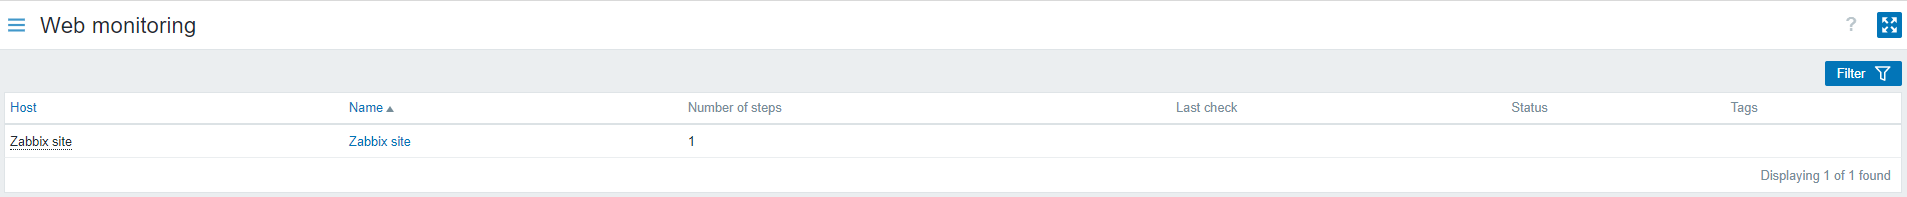
未知 - 显示Zabbix尚未收集数据的Web场景数量(灰色),
nor has an information about the failed steps.
查看状态和数据
小部件中的可点击链接允许轻松导航并快速获取每个Web场景的完整信息。 因此,要查看:
- Web场景的步骤3,点击一个主机组的名称。
- 更详细的统计信息,点击场景名称。在此示例中为"Zabbix frontend"。
- 当状态为Failed时的详细信息,点击一个主机组名称;在打开的窗口中, 点击Name列中的Web场景名称;这将打开关于Zabbix未能收集数据的配置步骤的更详细信息。
现在,您可以返回场景并更正您的设置。
要查看状态为Unknown时的详细信息,您可以重复与Failed状态相同的步骤。
在首次监控实例中,Web场景始终显示为Unknown状态, 在第一次检查后立即切换为Failed或Ok状态。 当一个主机由proxy监控时, 状态变化会根据proxy上配置的数据收集频率发生。