
24 Web監視
概要
このウィジェットはアクティブなWeb監視シナリオのステータス概要を表示します。
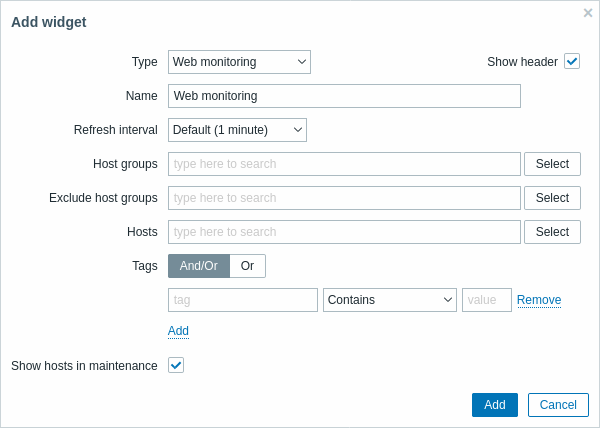
設定
ユーザーが特定のウィジェット要素にアクセスする権限を持っていない場合、その要素の名前はウィジェットの構成中にアクセス不能として表示されます。 これにより要素の実際の名前の代わりに、アクセスできないアイテム、アクセスできないホスト、アクセスできないグループ、アクセスできないマップ、およびアクセスできないグラフが表示されます。
すべてのウィジェットの共通パラメーターに加えて、次のオプションを設定できます。
| パラメーター | 詳細 |
|---|---|
| ホストグループ | ウィジェットに表示するホストグループを入力します。 このフィールドはオートコンプリートであるため、グループ名を入力し始めると、一致するグループ名がドロップダウンで表示されます。 親ホストグループを指定すると、ネストされたすべてのホストグループが暗黙的に選択され、ホストデータがウィジェットに表示されます。 ホストグループが入力されていない場合、すべてのホストグループが表示されます。 |
| 除外するホストグループ | ウィジェットから非表示にするホストグループを入力します。このフィールドはオートコンプリートであるため、グループ名を入力し始めると、一致するグループ名がドロップダウンで表示されます。 親ホストグループを指定すると、ネストされたすべてのホストグループが暗黙的に選択されます。 これらのホストグループからのホストデータはウィジェットに表示されますが、たとえばホスト001、002、003はグループAにあり、ホスト002、003もグループBにあるとします。その上でグループAを表示し、グループBを除外した場合、ホスト001からのデータのみがダッシュボードに表示されます。 |
| ホスト | ウィジェットに表示するホストを入力します。このフィールドはオートコンプリートであるため、ホストの名前を入力し始めると、一致するホスト名がドロップダウンで表示されます。 ホスト名が入力されていない場合は、すべてのホストが表示されます。 |
| タグ | タグを指定して、ウィジェットに表示されるWebシナリオの数を制限します。 特定のタグとタグ値を含めたり除外したりすることができます。 いくつかの条件を設定できます。 タグ名の照合では常に大文字と小文字が区別されます。 各条件で使用できる演算子はいくつかあります。 Exists - 指定されたタグ名を含める Equals - 指定されたタグ名と値を含める(大文字と小文字を区別) Contains - タグ値に入力された文字列が含まれる場合に指定されたタグ名を含める(文字列の部分一致、大文字と小文字を区別しない) Does not exist - 指定されたタグ名を除外する Does not equal-指定されたタグ名と値を除外する(大文字と小文字を区別) Does not contain - タグ値に入力された文字列が含まれる指定されたタグ名を除外する(文字列の部分一致、大文字と小文字を区別しない) 条件には2つの計算タイプがあります: And/Or - すべての条件が満たされる必要があり、同じタグ名を持つ条件はOr条件によってグループ化されます<br >Or - 1つの条件が満たされる |
| メンテナンス中のホストを表示 | メンテナンス中のホストを統計に含めます。 |
Web 監視ウィジェット
設定が完了したら、ウィジェットとそれに表示されるデータを確認します。これを行うには、監視 → ダッシュボード に移動し、ウィジェットを作成したダッシュボードの名前をクリックします。
この例では、「Zabbix frontend」という名前のウィジェットが、「Internal network」、「Linux servers」、および「Web servers」の3つのホストグループのWeb監視のステータスを表示しています。
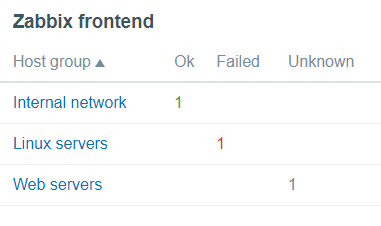
Web 監視ウィジェットには次の情報が表示されます
- a name of a widget; below it, there are four columns:
- Host group - displays a list of host groups that contain hosts having web scenarios configured;
- Ok - displays a number of web scenarios (in green color) when two conditions are observed:
- Zabbix has collected the latest data for a web scenario(s);
- all steps that were configured in a web scenario are in "Ok" Status.
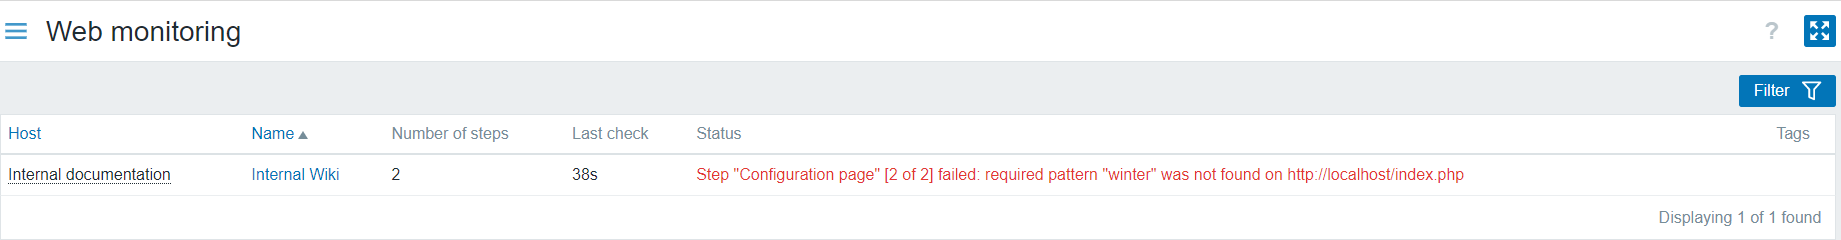
- Failed - displays a number of web scenarios (in red color), which have some failed steps:
- click on the host name, and it will open a new window; the Status column provides detailed information (in red color) on the step where Zabbix failed to collect the data; and also,
- gives a hint for the parameter that has to be corrected in the configuration form.
- Unknown - displays a number of web scenarios (in grey color) for which Zabbix has neither collected data,nor has an information about the failed steps.
ステータスとデータの表示
ウィジェット内のクリック可能なリンクを使用すると、簡単にナビゲートして、各 Web シナリオの完全な情報をすばやく取得できます。 したがって、表示するには:
- the Status of a web scenario, click on the name of a host group.
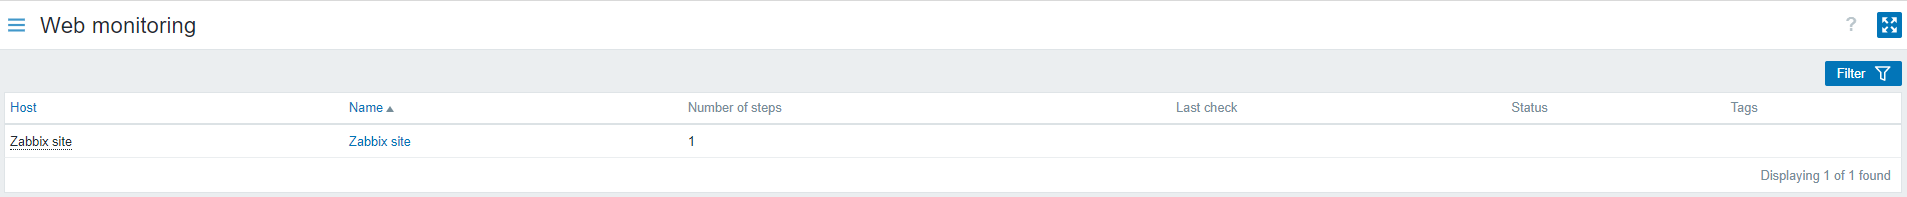
- more detailed statistics, click on the scenario name. In this example it is "Zabbix frontend".
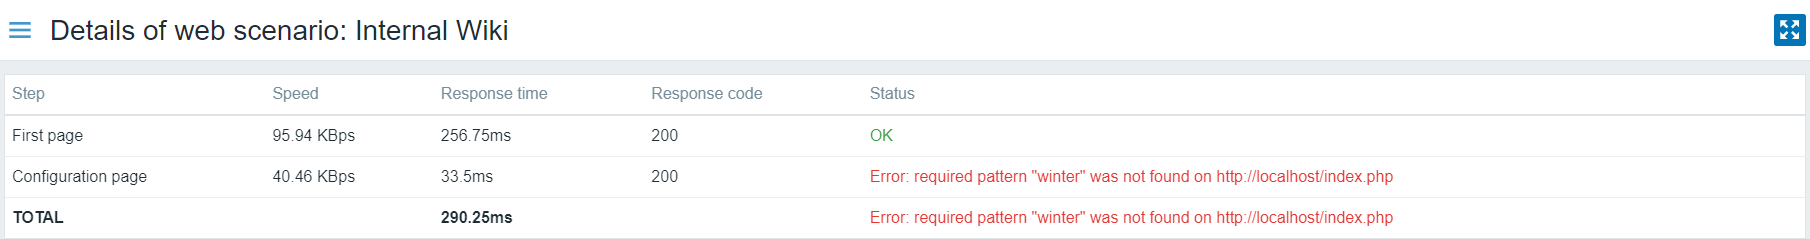
- the details in the case of Failed status, click on a host group name; in the window that opens, click on a web scenario name in the Name column; it will open more detailed information on the configured steps for which Zabbix failed to collect the data.
これで、Webシナリオ構成フォームに戻り、設定を修正できます。
Unknown ステータスの場合の詳細を表示するには、Failed の場合に説明したのと同じ手順を繰り返します。
最初の監視インスタンスでは、Web シナリオは常に Unknown 状態で表示され、最初のチェックの直後に Failed または OK 状態に切り替わります。ホストがプロキシによって監視されている場合、プロキシで設定されたデータ収集頻度に従ってステータスが変更されます。