
Apache web server monitoring
To start monitoring the Apache web server, follow this process:
- Ensure access to Apache statistics.
- Apply Apache monitoring template.
- Look at latest data.
To use this guide you must have Zabbix server and the web interface installed. You must be logged in to Zabbix as the default Admin user.
Access to Apache stats
The goal of this step is to make sure that Apache web server statistics can be read by Zabbix.
In Apache, real-time information about the server's performance and activity is provided by the built-in mod_status module. When enabled, it creates a web-accessible page (usually at /server-status) showing performance and activity data.
To verify that mod_status is enabled for the Apache web server, run:
| On Debian/Ubuntu | On RHEL-based systems |
|---|---|
apache2ctl -M | grep status |
httpd -M | grep status |
If you see "status_module (shared)" in the output then the status module is enabled already. If not, then you need to enable the status module.
Apply Apache monitoring template
In Zabbix this template is ready to use. It contains pre-configured elements ready for data collection, visualisation and analysis.
To apply the template:
-
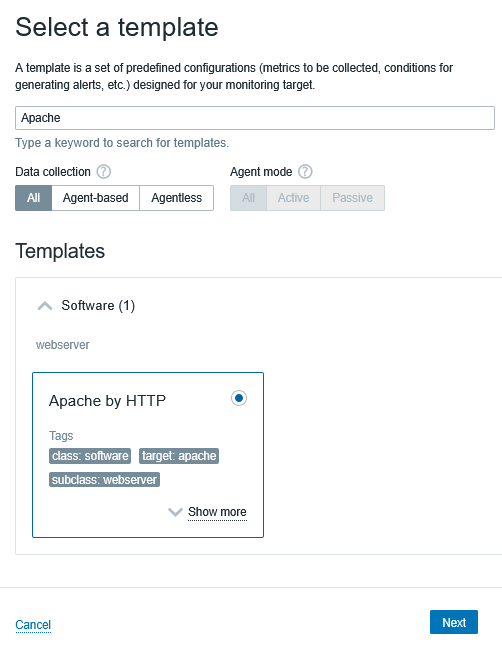
Start the Host Wizard in Data collection > Hosts.
-
Select the Apache by HTTP template.
- Create an Apache host, add a group for it. This virtual host will contain Apache-related data.
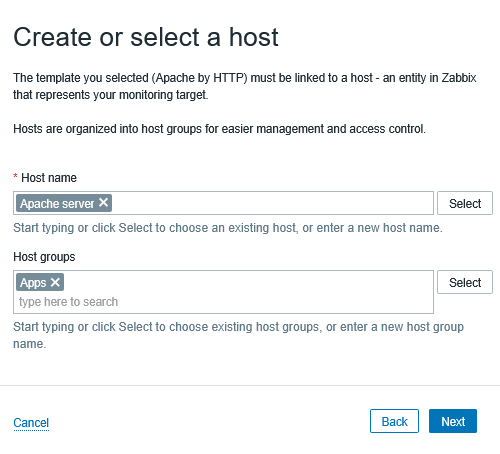
- Configure the host. Importantly, enter the Apache web server address (127.0.0.1 on a local machine, IP address on a remote machine).
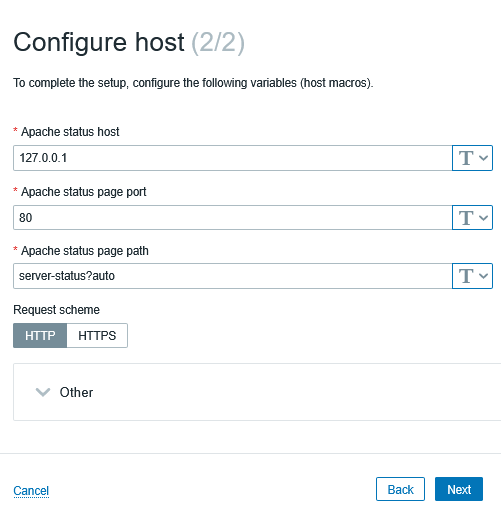
You can leave other settings to their defaults.
- To complete the Host Wizard, click Create and Finish.
Look at latest data
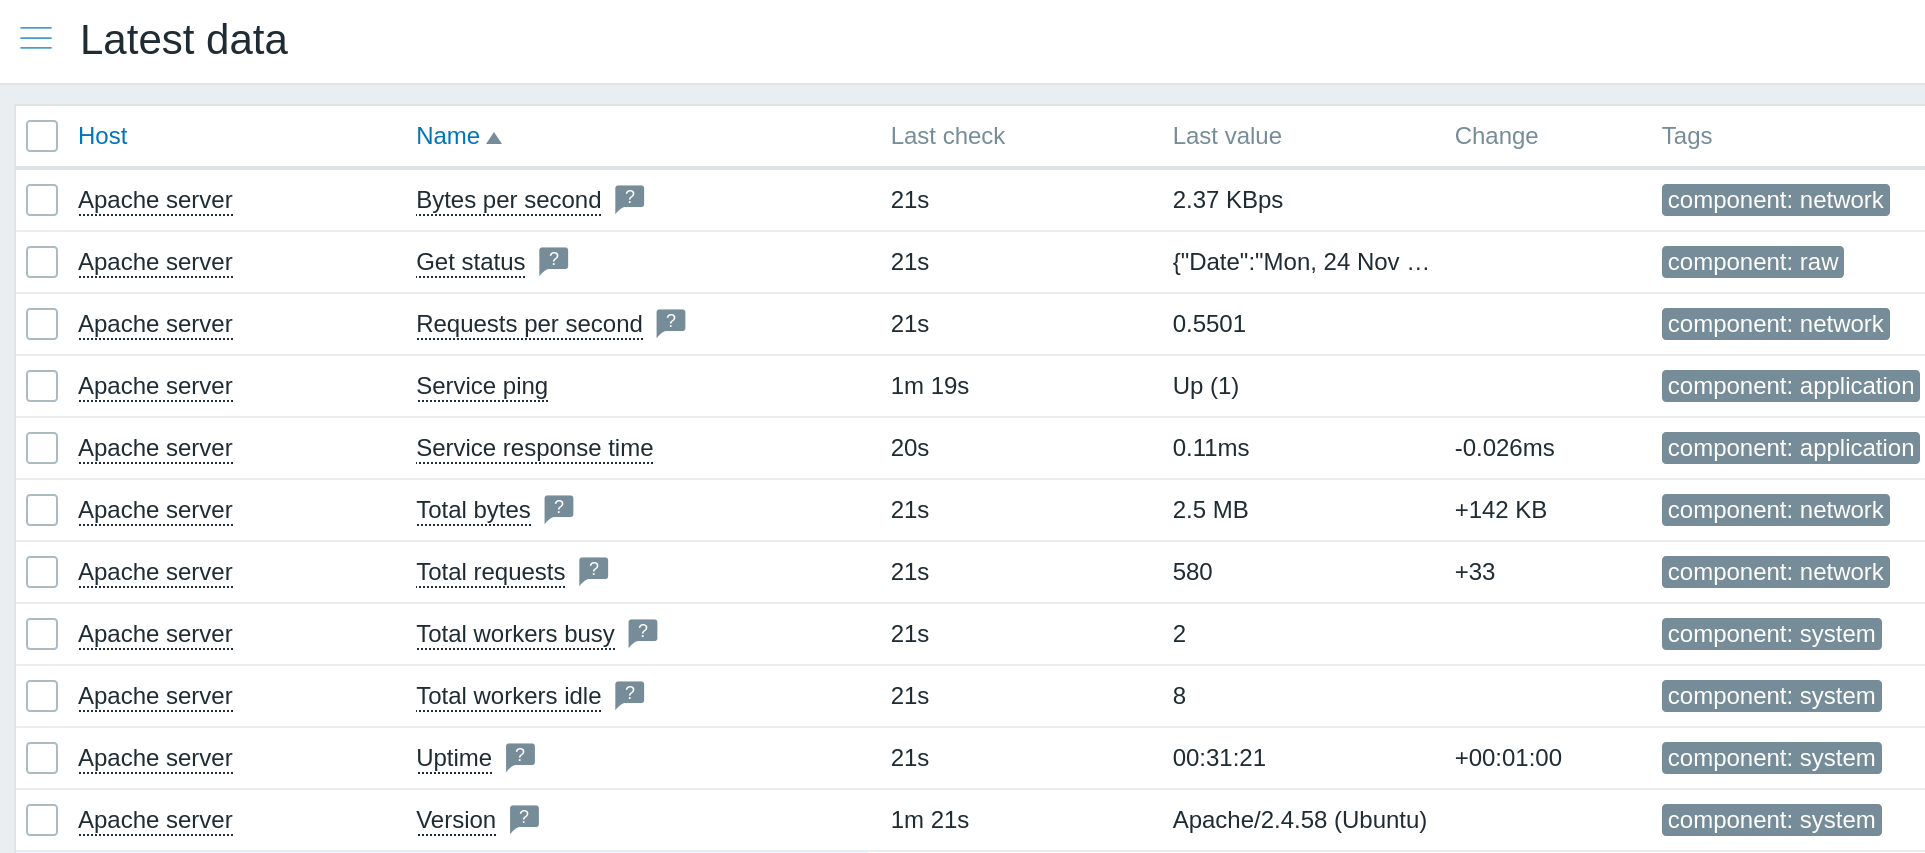
Congratulations, Apache web server monitoring has been started!
Zabbix provides visualisation options and delivers alerts if any problems arise. To configure alerts in the email, see Receiving problem notification.