
Top hosts
Overview
The Top hosts widget displays the top/bottom values for selected items from multiple hosts.
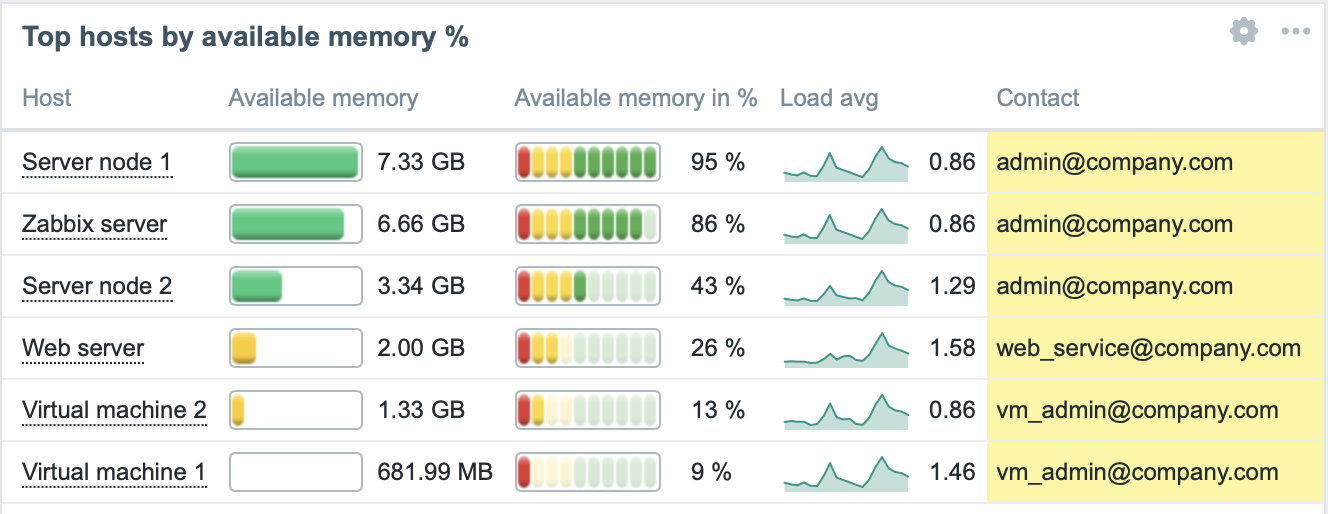
The widget supports displaying up to 1000 hosts simultaneously.
Configuration
To configure, select Top hosts as type:
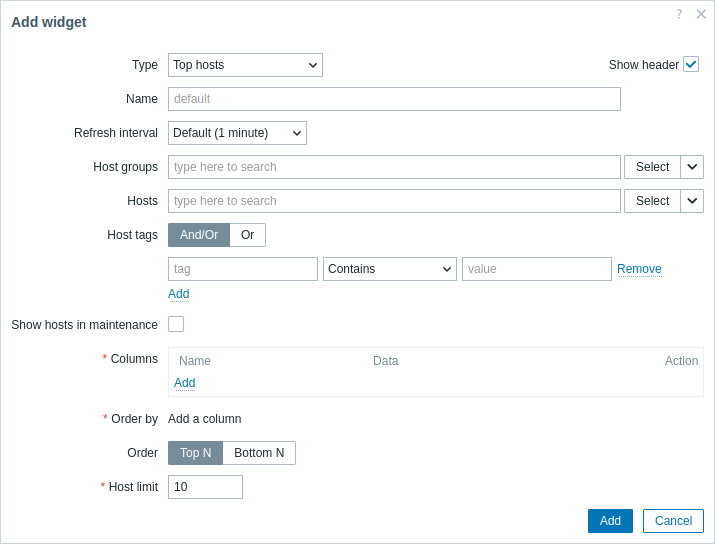
In addition to the parameters that are common for all widgets, you may set the following specific options:
| Host groups | Select host groups to display in the widget. Alternatively, select a compatible widget as the data source for host groups. This field is auto-complete, so starting to type the name of a group will offer a dropdown of matching groups. This parameter is not available when configuring the widget on a template dashboard. |
| Hosts | Select hosts to display in the widget. Alternatively, select a compatible widget or the dashboard as the data source for hosts. This field is auto-complete, so starting to type the name of a host will offer a dropdown of matching hosts. This parameter is not available when configuring the widget on a template dashboard. |
| Host tags | Specify tags to limit the number of hosts displayed in the widget. It is possible to include as well as exclude specific tags and tag values. Several conditions can be set. Tag name matching is always case-sensitive. There are several operators available for each condition: Exists - include the specified tag names; Equals - include the specified tag names and values (case-sensitive); Contains - include the specified tag names where the tag values contain the entered string (substring match, case-insensitive); Does not exist - exclude the specified tag names; Does not equal - exclude the specified tag names and values (case-sensitive); Does not contain - exclude the specified tag names where the tag values contain the entered string (substring match, case-insensitive). There are two calculation types for conditions: And/Or - all conditions must be met, conditions having the same tag name will be grouped by the Or condition; Or - enough if one condition is met. This parameter is not available when configuring the widget on a template dashboard. |
| Show hosts in maintenance | Mark this checkbox for hosts in maintenance to be displayed as well (in this case, maintenance icon will be shown next to the host name). Unmarked by default. |
| Columns | Add data columns to display. The column order determines their display from left to right. Columns can be reordered by dragging up and down by the handle before the column name. |
| Order by | Specify the column from the defined Columns list to use for Top N or Bottom N ordering. |
| Order | Specify the ordering of rows: Top N - in descending order according to the Order by aggregated value; Bottom N - in ascending order according to the Order by aggregated value. |
| Host limit | Number of host rows to be shown (1-1000). This parameter is not available when configuring the widget on a template dashboard. |
Column configuration
It is possible to add columns of three data types: host name, item value, or text. The list of available column parameters depends on the column data type and, for the item value type, on the value format.
Host name column
Host name column is used to display the name of the host.
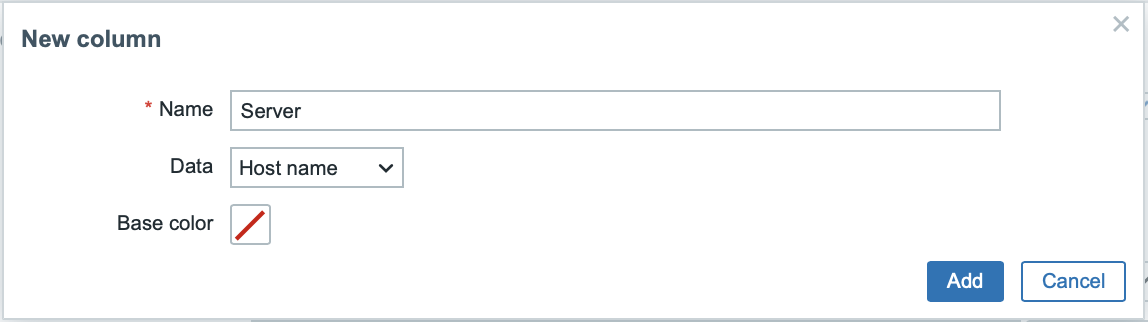
Supported parameters:
| Name | Name of the column. |
| Data | Data type to display in the column, select Host name. |
| Base color | Background color of the column. |
Text column
Text column is used to display any specified text string.
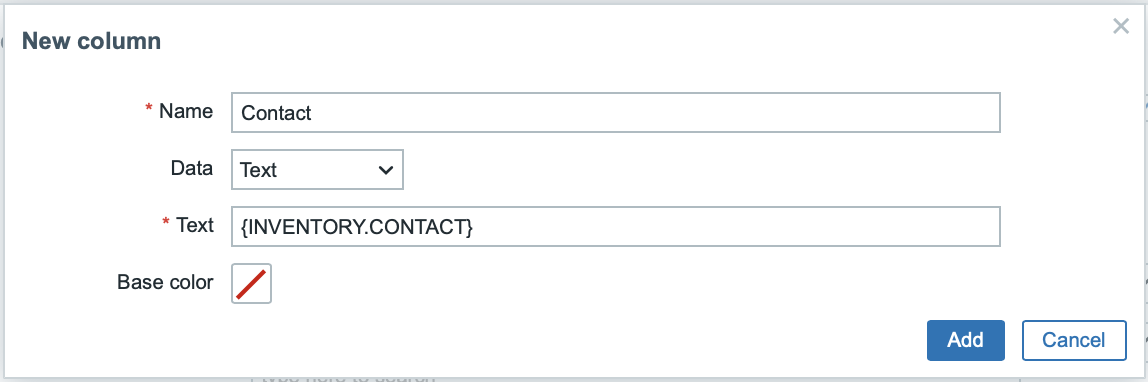
Supported parameters:
| Name | Name of the column. |
| Data | Data type to display in the column, select Text. |
| Base color | Background color of the column. |
| Text | Enter the string to display. May contain host and inventory macros. |
Item value column
Item value column is used to display value of the specified item; it supports multiple value display formats and options.
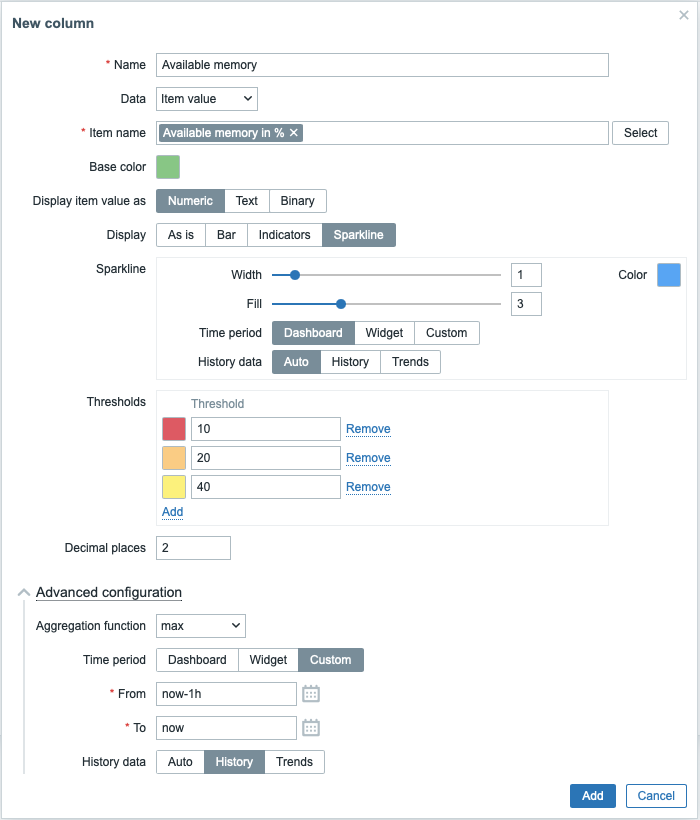
Supported parameters:
| Name | Name of the column. |
| Data | Data type to display in the column, select Item value. |
| Item name | Select an item; its name is used to match and display items with the same name on all selected hosts. If a host has multiple such items, the widget displays the item whose key is first alphabetically (e.g., CPU utilization with key proc.cpu.util instead of system.cpu.util).When configuring the widget on a template dashboard, only items configured on the template can be selected. |
| Base color | Background color of the column; fill color if Item value data is displayed as bar/indicators. The default color can be overridden by custom color, if the item value is over one of the specified thresholds. |
| Display item value as | Format for displaying the item value: Numeric, Text, or Binary. The selected option determines which additional parameters will be available. Refer to the parameter list for each format below. |
| Advanced configuration | |
| History data | Take data from history or trends: Auto - automatic selection; History - take history data; Trends - take trend data. This parameter is available only for numeric item values. For text and binary values data will always be taken from history. |
| Aggregation function | Specify which aggregation function to use within the selected Time period: min - display the smallest value; max - display the largest value; avg - display the average value; count - display the count of values; sum - display the sum of values; first - display the first value; last - display the last value. If not used is selected, the most recent value is displayed (no aggregation). Aggregation allows to display an aggregated value for the chosen interval (5 minutes, an hour, a day), instead of the most recent value. Only numeric data can be displayed for min, max, avg and sum. For count, non-numeric data will be changed to numeric. |
| Time period | Specify the time period to use for aggregating values. Select the data source for the time period: Dashboard - use the dashboard time period selector; Widget - use a compatible widget (set in the Widget parameter); Custom - use a custom time period set in the From and To parameters; if set, a clock icon will be displayed in the upper-right corner of the widget, indicating the set time on mouseover. Note that regardless of the widget's Time period configuration, compatible widgets can still use it as a data source for the time period. This parameter is not available if Aggregation function is set to "not used". |
| Widget | Enter or select a compatible widget as the data source for the time period. This parameter is available if Time period is set to "Widget". |
| From | Enter or select the start of the time period. Relative time syntax ( now, now/d, now/w-1w, etc.) is supported.This parameter is available if Time period is set to "Custom". |
| To | Enter or select the end of the time period. Relative time syntax ( now, now/d, now/w-1w, etc.) is supported.This parameter is available if Time period is set to "Custom". |
Numeric item value parameters:
| Display | Define how the value should be displayed: As is - as regular text; Bar - as solid, color-filled bar; Indicators - as segmented, color-filled bar; Sparkline - mini line graph. |
| Thresholds | Specify threshold values when the background/fill color should change. The list will be sorted in ascending order when saved. For sparklines, thresholds are applied only to the item last value. |
| Decimal places | Specify how many decimal places will be displayed with the value. |
| Bar/Indicators | |
| Min | Minimum value. |
| Max | Maximum value. |
| Sparkline | |
| Width | Set the graph line thickness by using the slider or manually entering a value in the range from 0 to 10. |
| Color | Select line and fill color. |
| Fill | Set fill color transparency level by using the slider or manually entering a value in the range from 0 to 10. |
| Time period | Specify the time period for values to be included into the sparkline chart. Select the data source for the time period: Dashboard - use the dashboard time period selector Widget - use a compatible widget (set in the Widget parameter); Custom - use a custom time period set in the From and To parameters; if set, a clock icon will be displayed in the upper-right corner of the widget, indicating the set time on mouseover. Note that regardless of the widget's Time period configuration, compatible widgets can still use it as a data source for the time period. |
| Widget | Enter or select a compatible widget as the data source for the time period. This parameter is available if Time period is set to "Widget". |
| From | Enter or select the start of the time period. Relative time syntax ( now, now/d, now/w-1w, etc.) is supported.This parameter is available if Time period is set to "Custom". |
| To | Enter or select the end of the time period. Relative time syntax ( now, now/d, now/w-1w, etc.) is supported.This parameter is available if Time period is set to "Custom". |
| History data | Take data from history or trends: Auto - automatic selection; History - take history data; Trends - take trend data. |
Text item value parameters:
| Highlights | Specify the regular expressions upon matching which the background/fill color should change. |
Binary item value parameters:
| Show thumbnail | Specify whether to create and display a thumbnail for the image containing binary data or to display a hyperlink Show leading to the full-size image in the value column. |