Dashboard widget parameters
Overview
This page describes parameters that are common to all dashboard widgets, as well as dynamic parameters that allow multiple widgets to exchange configuration data with each other or with the dashboard.
To see specific parameters for each widget, please use the sidebar to navigate to the corresponding widget page.
Common parameters
The following parameters are common for every single widget:
| Name | Enter a widget name. |
| Refresh interval | Configure the default refresh interval. Default refresh intervals for widgets range from No refresh to 15 minutes depending on the type of the widget. For example: - No refresh for URL widget; - 1 minute for Action log widget; - 15 minutes for Clock widget. Refresh intervals can be set to a default value for all users. Switch the dashboard to edit mode, click the edit a widget button and select the desired refresh interval from the dropdown list. Each user can also set their own widget refresh interval. In the dashboard view mode, click the three dots  button on a widget and select the desired refresh interval from the dropdown list. Note that a user's unique refresh interval takes priority over the widget setting and is preserved even when the widget's setting is modified. button on a widget and select the desired refresh interval from the dropdown list. Note that a user's unique refresh interval takes priority over the widget setting and is preserved even when the widget's setting is modified. |
| Show header | Mark the checkbox to permanently display the widget header. When unmarked, the header is hidden to save space and becomes visible only on widget mouseover (both in view and edit modes). The header is also semi-visible when dragging a widget to a new place. |
Dynamic parameters
Multiple widget parameters (e.g., Hosts, Override host, Time period) support dynamic data sources. Instead of configuring static values, you can link these parameters to other widgets or the dashboard itself. Widgets are then automatically updated based on selections or broadcasts from other parts of the dashboard.
Widget compatibility
Some widgets can broadcast configuration data to other widgets, some can listen for data, and some can do both. For example:
- The Action log widget can only retrieve time period data from Graph, Graph (classic), and Graph prototype widgets.
- The Geomap widget can broadcast host data to widgets that listen for it (Honeycomb, Top items, etc.) and can also listen for host group and host data from widgets that broadcast it (Honeycomb, Problem hosts, etc.).
- The Clock widget cannot broadcast or listen for any data.
The following table outlines the broadcasting and listening capabilities of each widget.
| Widget | Broadcasts | Listens |
|---|---|---|
| Action log | - | Time period |
| Clock | - | - |
| Discovery status | - | - |
| Favorite graphs | - | - |
| Favorite maps | - | - |
| Gauge | - | Hosts, Items |
| Geomap | Hosts | Host groups, Hosts |
| Graph | Time period, Items | Hosts, Items, Time period |
| Graph (classic) | Time period | Hosts, Items, Graphs, Time period |
| Graph prototype | Time period | Hosts, Time period |
| Honeycomb | Hosts, Items | Host groups, Hosts |
| Host availability | - | Host groups |
| Host card | - | Hosts |
| Host navigator | Hosts | Host groups |
| Item card | - | Hosts, Items, Time period |
| Item history | Items | Hosts, Time period |
| Item navigator | Items | Host groups, Hosts |
| Item value | - | Hosts, Items, Time period |
| Map | Host groups, Hosts | Maps |
| Map navigation tree | Maps | - |
| Pie chart | - | Items, Time period |
| Problem hosts | Host groups | Host groups, Hosts |
| Problems | Events | Host groups, Hosts |
| Problems by severity | Host groups | Host groups, Hosts |
| Scatter plot | Time period, Items | Hosts, Items, Time period |
| SLA report | - | - |
| System information | - | - |
| Top hosts | Hosts | Host groups, Hosts |
| Top items | - | Host groups, Hosts |
| Top triggers | - | Time period |
| Trigger overview | - | Host groups, Hosts |
| URL | - | Hosts |
| Web monitoring | Host groups | Host groups, Hosts |
Widgets differ in how they broadcast data to other widgets.
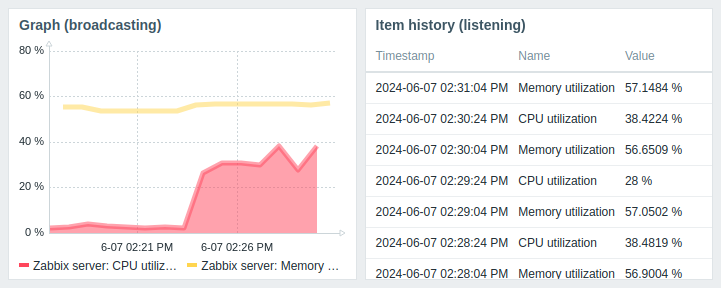
Widgets that support broadcasting start doing it automatically when created. For example, the Graph widget immediately broadcasts time period data to listening widgets.
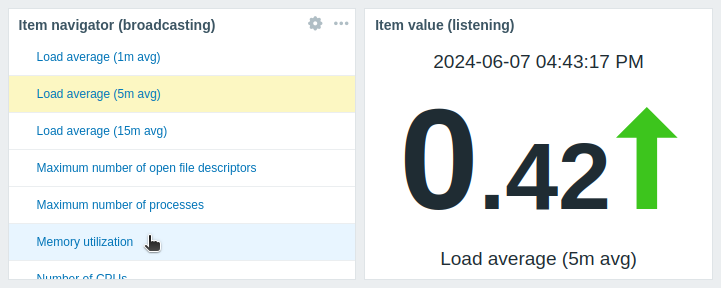
Widgets that support entity selection automatically broadcast data for the first available entity. For example, the Item navigator widget broadcasts data for the first item in its item list. When a different item is selected, it broadcasts data for that item. On mouseover, the item is highlighted in light blue; on selection, it is highlighted in yellow.
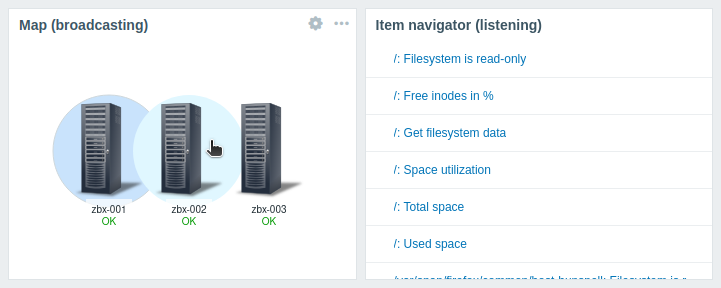
The Map widget behaves similarly, broadcasting data for the first element closest to the upper-left corner of the widget's visible area (for the Geomap widget, closest to the center). When a different element is selected, it broadcasts data for that element. On mouseover, the element is highlighted in light blue; on selection, it is highlighted in dark blue.
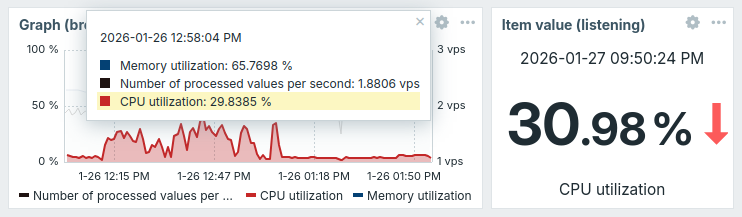
Widgets such as the Graph and Scatter plot can broadcast item data when an item is selected in their tooltips:
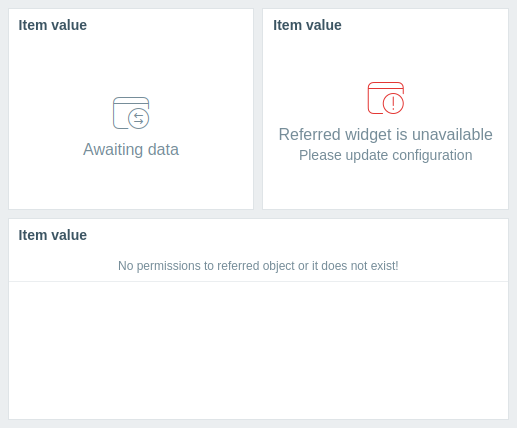
Widgets also have specific behaviors when listening for data from other widgets:
- If the data source widget is not broadcasting data, the listening widget enters the Awaiting data state.
- If the data source widget has been deleted, replaced with an incompatible widget, or moved to another dashboard page, the listening widget enters the Referred widget is unavailable state.
- If the specified host in the data source (widget or dashboard) lacks the entity configured in the listening widget (item, graph, map, etc.) or if the user lacks permissions to access the host, the listening widget displays the following message: "No permissions to referred object or it does not exist!"