
- What's new in Zabbix 8.0
- Databases
- Templates
- Items
- Plugins
- Low-level discovery
- Processes
- SNMPv3 EngineID caching and reuse
- Refined proxy throttling during history cache recovery
- Increased maximum timeout for the zabbix_get and zabbix_js
- Optimized housekeeping
- Manual close — trigger tags inherited by recovery events
- DNS query caching for Zabbix daemons
- Build support for c-ares on Windows
- Count-based trigger functions improved
- Authentication
- Widgets
- Frontend
- New and embedded fonts
- Inline validation
- Modal forms
- Inherited tags visible in hosts, templates, items, and triggers
- Tooltips positioning
- Support for multiple PostgreSQL database hosts
- New $ZBX_FEATURE_FLAGS variable in frontend configuration
- New AllowKeyRegexp and DenyKeyRegexp parameters in Zabbix agent and Zabbix agent 2 configuration
- Event details show suppression reason
- Changes to the Zabbix SELinux policy package
- Dashboard slideshow setting
- Documentation
What's new in Zabbix 8.0
Zabbix 8.0.0 continues from Zabbix 7.4.0, adding new features and enhancements.
See breaking changes for this version.
Customizable tables
You can now customize tables in these sections of the web interface:
- Data collection > Templates and Hosts
- Monitoring > Hosts, Latest data, and Problems
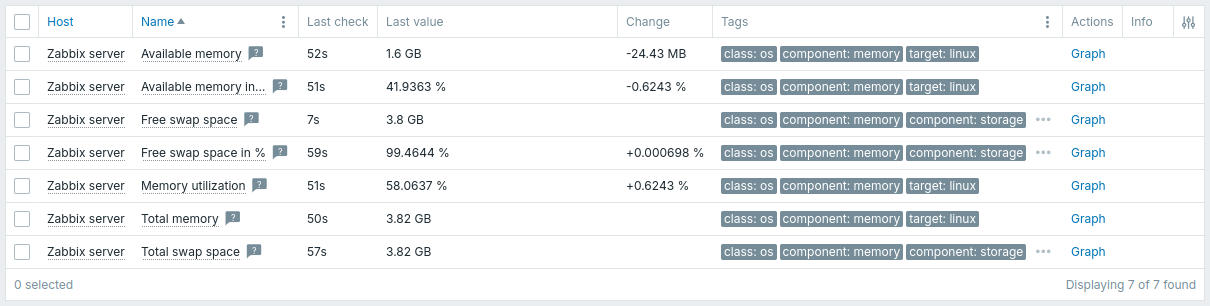
You can show, hide, reorder, and resize columns in these tables. You can also add a new Custom text column that shows custom text, macro values, or both.
For example, the default table layout in Monitoring > Latest data:
An example of a custom layout:
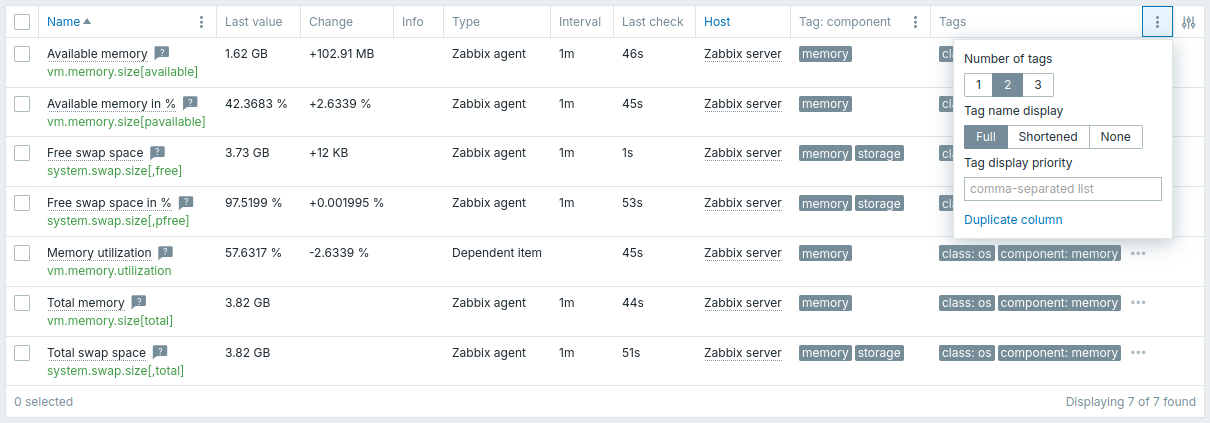
Some columns now also have the  Options button that provides additional controls over how that column displays data.
Because of this, some filter parameters have been moved from the filter tab to column options.
If you're using tabs for favorite filters, please see Upgrade notes.
Options button that provides additional controls over how that column displays data.
Because of this, some filter parameters have been moved from the filter tab to column options.
If you're using tabs for favorite filters, please see Upgrade notes.
Scatter plot widget
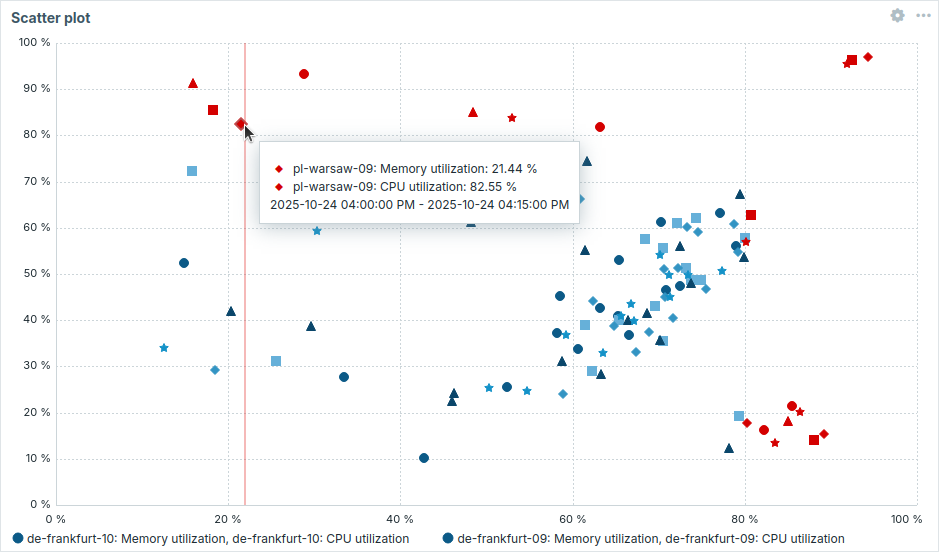
The Scatter plot widget has been added to dashboard widgets. It displays the relationship between two metrics by plotting individual data points along an X and Y axis. This helps reveal patterns, clusters, correlations, and outliers in the data set.
Y-axis inversion for the Graph widget
Graphs in the Graph widget can now be displayed with inverted Y-axis values. A new Invert values setting allows you to multiply Y-axis values by −1 without altering the original data.
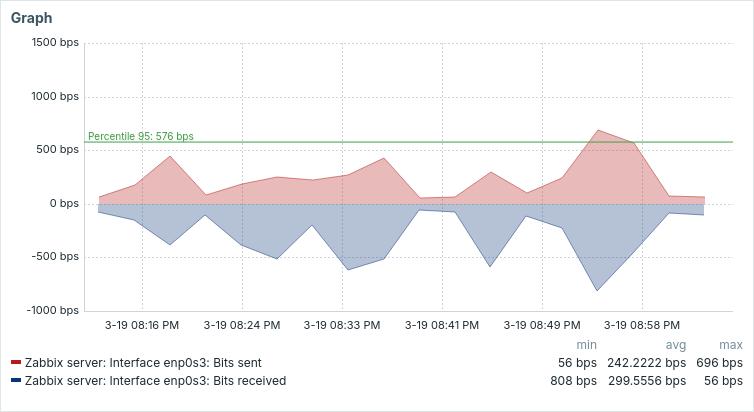
See also: Graph widget enhancements.
Accessibility enhancement
Added the Skip to main content link to improve keyboard navigation and accessibility.

The link allows keyboard and screen reader users to skip repetitive sidebar navigation and move directly to the main content.
It remains hidden during normal use and appears only when focused, such as when the Tab key is pressed after the page loads or when it is accessed using a screen reader.
Zabbix UI enhancements
The Zabbix user interface has been modernized to improve accessibility and usability.
| Before | After |
|---|---|
 |
 |
Databases
ClickHouse support for history storage
You can now use ClickHouse as a Zabbix backend database to store item value history.
For setup details and requirements, see ClickHouse setup.
This feature also changes how you set history storage providers in Zabbix configuration files. This change affects both ClickHouse and Elasticsearch setups. For details, see Upgrade notes.
Optimized Zabbix server startup
Zabbix server now starts up significantly faster. It does so by loading history data from the database for multiple items at once instead of one at a time. This improvement applies to all database types supported by Zabbix server.
Optimized Elasticsearch performance
Zabbix server now works better with Elasticsearch. The server retrieves data more efficiently without using Elasticsearch's scroll feature, and reuses existing connections to Elasticsearch instead of opening a new one for every request. The server also no longer hangs when sending multiple requests to Elasticsearch at the same time (using cURL's multi-handle).
Templates
New templates
- Aruba CX 8300s by SNMP, a template providing SNMP-based monitoring for the Aruba CX 8300 switch series.
- The AWS by HTTP template set has been supplemented with the template AWS Backup Vault by HTTP.
- The Azure by HTTP template set has been supplemented with the templates Azure Sentinel by HTTP and Azure Container Apps by HTTP.
- Ciena 3906 by SNMP, a template for monitoring Ciena 3906 devices.
- Cisco Secure Firewall Threat Defense by HTTP, a template providing monitoring capabilities for Cisco Secure Firewall Threat Defense devices using REST API.
- Claude API by HTTP, a template for monitoring Claude API usage and costs.
- Cradlepoint NCM v2 by HTTP, a template set for monitoring Cradlepoint NCM v2 and its devices via HTTP.
- Domain RDAP by HTTP, a template for monitoring domain registration data via the RDAP protocol.
- The GCP by HTTP template set has been supplemented with the templates GCP Cloud Run Service by HTTP, GCP Cloud Storage Bucket by HTTP, and GCP Application Load Balancer by HTTP.
- GLPI by HTTP, a template for monitoring GLPI via HTTP using the REST API v2 with OAuth2 authentication.
- Huawei AR600 by SNMP, a template for monitoring Huawei AR600 routers, including CoS and NQA metrics.
- IBM Maximo Service Request, a webhook-based template that enables linking Zabbix to IBM Maximo.
- Kubernetes Cluster by HTTP, a template for monitoring Kubernetes clusters via HTTP using
kube-state-metricsand the Kubernetes API. - MariaDB by ODBC, a template for monitoring MariaDB databases via ODBC.
- MariaDB by Zabbix agent and MariaDB by Zabbix agent active, templates for monitoring MariaDB databases via Zabbix agent and Zabbix agent active.
- Microsoft Hyper-V Failover Cluster by SSH and Microsoft Hyper-V Standalone by SSH, templates for monitoring Microsoft Hyper-V clusters and standalone hosts via SSH.
- OpenAI Platform by HTTP, a template for monitoring OpenAI's developer platform.
- The Oracle Cloud by HTTP template set has been supplemented with the template Oracle Cloud Load Balancer by HTTP.
- Percona by ODBC, a template for monitoring Percona databases via ODBC.
- Percona by Zabbix agent and Percona by Zabbix agent active, templates for monitoring Percona databases via Zabbix agent and Zabbix agent active.
- Podman by Zabbix agent, by Zabbix agent active, and by HTTP: templates for monitoring Podman containers and service health via the Podman API. Note that the Podman API does not support authorization methods.
- Ribbon SBC Edge by HTTP, a template for monitoring Ribbon SBC Edge (formerly SWe Lite) devices via HTTP.
- Ribbon SBC SWe Core by HTTP, a template for monitoring SBC SWe Core devices via HTTP, and Ribbon SBC SWe CE by HTTP, a template for monitoring Ribbon SBC SWe Call Engine (CE) instances via HTTP.
- Stormshield SNS by SNMP, a template for monitoring Stormshield Network Security (SNS) devices via SNMP.
- VeloCloud SD-WAN Edge by HTTP, a template for monitoring VeloCloud SD-WAN Edge devices via HTTP.
- Vyatta Virtual Router by SNMP, a template for monitoring the Vyatta 1908e virtual router.
Updated templates
- Ceph by Zabbix agent 2 now supports native connection mode. See Ceph plugin for details.
- Ciena 3906 by SNMP has been updated to include filesystem and CPU load items.
- GitHub organization by HTTP has been updated to include items for monitoring Microsoft Copilot.
- The GLPI webhook media type has been updated to support the RESTful API v2 with OAuth2 authorization (enabled by default), optional legacy REST API v1 support via configuration flag, ticket creation for problem events, and user-configurable urgency mapping.
- Microsoft 365 reports by HTTP has been updated to include items for monitoring Microsoft Copilot.
- MySQL by Zabbix agent, MySQL by Zabbix agent 2, MySQL by Zabbix agent active, MySQL by Zabbix agent 2 active, and MySQL by ODBC have been updated to support both
SHOW SLAVE STATUS(old syntax) andSHOW REPLICA STATUS(new syntax). - Additionally, MySQL by Zabbix agent, MySQL by Zabbix agent active, and MySQL by ODBC have been updated with new metrics, an improved dashboard, and expanded discovery rules for tables (as well as replicas for MySQL by ODBC).
- PostgreSQL by ODBC has been updated with new metrics, discovery rules, and dashboards, along with general improvements to performance and observability.
- Proxmox VE by HTTP has been updated with the nested LLD functionality. In addition, the unit format for items displaying percentages has been adjusted for clarity.
- Redis by Zabbix agent 2 has been updated with authentication via user and password macros and improved item descriptions.
- Veeam Backup and Replication by HTTP and Veeam Backup Enterprise Manager by HTTP have been updated with new monitoring capabilities and support for Veeam Backup & Replication v13.
- VeloCloud SD-WAN by HTTP, previously VMWare SD-WAN VeloCloud by HTTP, has been renamed and updated to align with the latest VeloCloud SD-WAN platform.
- In the VMware and VMware FQDN template sets, the item and trigger prototype names for VMware alarm discovery have been updated to include the alarm entity name.
- Vyatta Virtual Router by SNMP has been updated with new OID items and dashboard enhancements.
Items
JSON data type
Zabbix now supports JSON as a data type for item values.
Previously, JSON values were collected by text items and stored as strings with a limit of 64KB. Now, Zabbix can store JSON values natively with a limit of 128MiB, and also reject invalid JSON values (e.g., containing unquoted keys, trailing commas, mismatched brackets).
The JSON data type is supported by all item types and item prototypes (except Calculated), and is available in real-time data export and connectors. JSON values can be stored in all supported databases and Elasticsearch. If you're using TimescaleDB, please see upgrade notes.
Note that JSON items cannot be used in triggers; however, you can extract JSON fields with dependent items that have a non-JSON data type and use them in triggers.
Items that return a JSON string (net.if.discovery, vfs.file.get, etc.) are still text items; however, you can change them to JSON if needed.
For more details and JSON data limits, see item configuration.
Type parameter for S.M.A.R.T disk discovery
The smart.disk.discovery item (Zabbix agent 2 S.M.A.R.T. plugin) now accepts an optional type parameter to specify a value to scan for the disks.
Default value for trapper item allowed hosts
The Allowed hosts field for Zabbix trapper items and for HTTP agent items with Enable trapping enabled, now uses the user macro {$TRAPPER.ALLOWED_HOSTS} by default.
If this value is empty, incoming connections are denied from all hosts.
To allow data submission, specify one or more IP addresses or DNS names.
Trend function cache utilization monitoring
The paccessed parameter has been added to the zabbix[tcache,cache,<parameter>] internal item.
It returns the percentage of trend function cache entries accessed within the last 24 hours.
Plugins
Ceph plugin
The Zabbix agent 2 Ceph plugin now operates in two modes:
- native - This mode uses the go-ceph library to communicate directly with the Ceph cluster using the native Ceph API (msgr2 protocol). This is the recommended mode for modern Ceph installations, but is only supported on Linux and starting with Ceph 16.
- restful (deprecated) - This mode uses the Ceph RESTful API for communication.
It is the default mode for backward compatibility but will not work with Ceph version 20 (Tentacle) or newer due to the removal of the
mgr/restfulmodule.
Important: When monitoring Ceph 20 (Tentacle) and newer versions with the Ceph plugin for Zabbix agent 2, use native mode, as the restful mode is no longer supported.
Which mode to use is determined by the value of the mode parameter (native/restful):
Plugins.Ceph.Default.Mode=native- set the native mode for the pluginPlugins.Ceph.Sessions.<SessionName>.Mode=native- set the native mode for the named session
Note that the user credential set differs for each mode and they are not compatible with each other.
The Plugins.Ceph.InsecureSkipVerify parameter is ignored in native mode because connection security is defined on the Ceph cluster side by msgr2 protocol (secure by default).
Note that the Ceph plugin for Zabbix agent 2 is now a loadable plugin and requires additional installation steps. This is due to the librados package requirement (for the native mode). See the Ceph plugin readme for details.
MongoDB plugin
The Zabbix agent 2 MongoDB plugin offers multiple enhancements:
- Full support for conventional MongoDB URI parsing, with support for both
mongodb://andmongodb+srv://schemes. - Automatic discovery of MongoDB replica set nodes, enhancing the ability to monitor MongoDB clusters.
- Support for x509 authentication, enabling secure connections to MongoDB using client certificates.
Oracle plugin
The Zabbix agent 2 Oracle plugin now supports encrypted connections to Oracle databases using the TCPS (TLS) protocol. This adds the ability to monitor Oracle instances over TLS-secured sockets, improving security for remote monitoring.
Redis plugin — TLS support and startup-time validation
TLS support has been added to the Zabbix agent 2 Redis plugin.
Startup-time validation of the plugin TLS configuration was implemented and validation/error messages improved.
An invalid configuration logic (for example: using connection type verify_full without specifying TLSCAFile) can prevent Zabbix agent 2 from starting.
Test execution mode for loadable plugins
Loadable plugins can now be launched in test mode using the -t (--test) flag, passing an item key as argument.
In this mode, the plugin runs for debugging and development purposes, and plugin configuration files are ignored.
Low-level discovery
Convert to JSON checkbox in discovery forms
A new Convert to JSON checkbox was added to the low-level discovery rule form and discovery prototype form, which is shown if "HTTP agent" is selected in the Type dropdown. This option allows to mark retrieved data for automatic conversion to JSON before further processing.
Macro support for nested low-level discovery
Low-level discovery macros are now supported in nested low-level discovery rules, in:
- JSONPath preprocessing parameters
- JSONPath field for custom LLD macros
Editable tags for triggers created by low-level discovery
Triggers created from trigger prototypes can now have tags added manually. Tags inherited from trigger prototypes are still applied automatically. Tags added manually may be modified on discovered triggers and will be included in event tag arrays and available to tag-aware features such as filters, dashboard widgets and notification macros.
Block device discovery on Linux and AIX
The new vfs.dev.get item key was added for block device discovery on Linux and AIX.
It can be used in low-level discovery for block devices.
The vfs.dev.discovery item key remains available for compatibility.
Network interfaces discovery on Linux
The new net.if.get item key has been added to Zabbix agent and Zabbix agent 2 on Linux.
It can be used in low-level discovery of network interfaces to return a list of network interfaces with detailed information.
The net.if.discovery item key remains available for compatibility.
Processes
SNMPv3 EngineID caching and reuse
Zabbix now caches SNMPv3 EngineID → IP mappings and will attempt to reuse cached EngineIDs for subsequent SNMPv3 checks, reducing probe traffic and improving poller performance. If a reused EngineID does not respond, the poller falls back to an EngineID probe and may remove stale entries after interface changes or persistent failures.
Refined proxy throttling during history cache recovery
Proxy throttling logic has been refined to improve server stability during history cache recovery. When history cache usage reaches the throttling threshold, the server continues to stop accepting proxy data as before. When cache usage falls to 60%, the server begins processing the throttling list but may still reject proxy uploads that contain very large batches (approximately more than 10k records) until cache pressure decreases further. This change reduces the risk of repeated cache overloads while the server recovers.
Increased maximum timeout for the zabbix_get and zabbix_js
The maximum value for the timeout parameter of the zabbix_get and zabbix_js command-line utilities has been increased to 600 seconds.
Optimized housekeeping
Housekeeping has been optimized by moving the creation of housekeeper tasks to database triggers.
When items (including low-level discovery rules), triggers, services, or network discovery rules are deleted, database triggers (instead of explicit application-level calls) now populate the housekeeper table with cleanup tasks.
For details, see the housekeeping procedure.
The housekeeper now also removes network discovery events generated from discovered hosts or services that have since been deleted, as well as all events associated with problems of triggers that have since been deleted (previously, only the problems themselves were removed; associated events were only removed after the housekeeper Trigger data storage period expired).
Manual close — trigger tags inherited by recovery events
Recovery events created after a manual close inherit trigger tags in addition to item and host tags.
These tags are present in the event tags array and are available to notification macros such as {EVENT.RECOVERY.TAGS} and {EVENT.RECOVERY.TAGSJSON}.
DNS query caching for Zabbix daemons
Zabbix server, Zabbix proxy and Zabbix agent received support for using the c-ares resolver for all DNS requests, providing DNS query caching and improved resolver failover when Zabbix is built with --with-ares.
DNS query caching requires c-ares 1.26.0 or later.
Build support for c-ares on Windows
Zabbix agent can now be built with the c-ares resolver on Microsoft Windows.
c-ares may be installed via vcpkg, and the agent build supports either ARES=<vcpkg prefix> or separate ARESINCDIR/ARESLIBDIR paths for include and library directories.
Count-based trigger functions improved
The operation of count-based functions (count(), item_count(), changecount(), etc.) in trigger expressions has been improved, allowing more values to be processed faster.
Authentication
Importable SAML certificates for single sign-on
Super admin users can now import certificates and private keys directly in the frontend for SAML configuration. Three new fields were added to Users > Authentication > SAML settings:
- IdP certificate - X.509 certificate presented by the identity provider
- SP certificate - service provider certificate used for SAML exchanges
- SP private key - private key corresponding to the SP certificate
These controls allow adding new values or modifying existing ones from the SAML settings tab. Certificates and private keys are validated before being saved to the chosen storage backend; invalid or malformed values are rejected with an explanatory error.
Widgets
Geomap host marker clustering
The Geomap widget now supports a Clustering parameter to control how nearby host markers are combined into a single marker with a count. By setting the map zoom level for clustering, you can keep large maps readable and maintain precise visibility when zoomed in.
Aggregate columns in Top items
The Top items widget can now group item patterns into a single aggregated column or row, making it easy to present combined metrics (for example: total incoming traffic across all network interfaces of a host). Three new options were added when configuring item columns:Aggregate columns, Column aggregation function, and Combined column name.
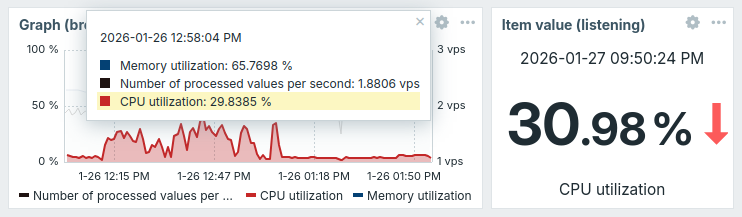
Graph widget enhancements
The Graph widget offers multiple usability enhancements:
- Items in the graph data tooltip that appears when hovering over the graph are sorted by value in descending order.
- Hovering over an item in the tooltip highlights its graph while dimming others.
- Selecting an item in the tooltip broadcasts its data to other widgets that support listening to it.
- The limit on the number of items displayed in the tooltip has been removed.
- A new Host names in labels setting allows you to choose whether host names are displayed in the tooltip and graph legend.
- A new Invert values setting allows you to flip a graph.
Increased character limit for widget description fields
The character limit for the Description field in the Gauge and Item value widgets has been increased from 2048 to 65535 characters.
Dashboard export and import
Dashboards can now be exported and imported, making it easier to migrate dashboards between Zabbix instances or reuse them in different environments.
A new Export option allows saving selected dashboards to YAML, JSON, or XML files. These files can later be imported through the Import functionality to recreate the dashboards with their pages, widgets, and configuration.
Frontend
New and embedded fonts
Zabbix now includes new and embedded fonts that improve readability, load faster, and render additional frontend languages with minimal layout impact. Being embedded, these fonts also ensure a consistent appearance across systems.
New fonts: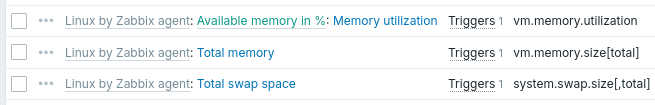 |
Legacy fonts: |
The new fonts are used in almost all themes. If needed, the newly added Blue (classic) and Dark (classic) themes are available with legacy fonts.
The font family for monospace content and graphs remains unchanged.
Inline validation
The following forms in the frontend have been added to the set of forms that support inline validation:
- API token
- Audit log
- Authentication
- Autoregistration
- Connector
- Event correlation
- Geographical maps
- Graph prototypes
- Custom graphs
- GUI
- Host group
- Host prototypes
- Housekeeping
- Icon mapping
- Images
- Maintenance
- Media type
- Notifications
- Other configuration parameters
- Profile
- Proxy
- Proxy group
- Regular expressions
- Scheduled reports
- Script
- Service
- SLA
- Template group
- Test item
- Test media type
- Timeouts
- Trigger displaying options
- Trigger expression constructor
- Update problem
- User groups
- Global user macros
- User roles
- Users
Input errors are displayed immediately after filling in the fields, improving usability and reducing configuration mistakes.
Modal forms
In low-level discovery setup, the host prototype configuration form is now opened in a modal (pop-up) window.
Inherited tags visible in hosts, templates, items, and triggers
Inherited tags are now displayed and returned consistently across templates, hosts, items, web scenarios, and triggers. Tags inherited from template/host chains are visible in Monitoring > Latest data. Filtering by inherited tags is available wherever tag filtering is supported — including the Monitoring > Latest data and Data collection sections, and all dashboard widgets that allow filtering by host, item, trigger, or web scenario tags — so tag-based selection and subfiltering behave the same regardless of where a tag was defined.
The Tags tab on template, host and host prototype configuration forms now exposes a radio element to choose how tags are presented: templates show Template tags / Inherited and template tags, and hosts and host prototypes show Host tags / Inherited and host tags. Inherited tags are visually distinguished by a new outlined document icon next to the tag label.
Graph and Pie chart widgets include a new Item tags setting.
Tooltips positioning
Tooltips can now be repositioned by dragging them to a new location. This applies, for example, to the Graph tooltip, as well as to tooltips with descriptions in the Latest Data or Problems sections.
Support for multiple PostgreSQL database hosts
Zabbix now supports specifying multiple PostgreSQL database hosts as a comma-separated list of host:port values, leveraging PostgreSQL connection failover support.
The hosts are tried in order until a read-write connection is established.
This behavior is available during frontend installation in the Database host field and in DBHost in zabbix_server.conf and zabbix_proxy.conf.
New $ZBX_FEATURE_FLAGS variable in frontend configuration
The new $ZBX_FEATURE_FLAGS[] variable has been implemented in the frontend configuration to control access to user HTTP authentication, modules, and media types configurations.
The following feature flags have been added to the zabbix.conf.php configuration file:
$ZBX_FEATURE_FLAGS['http_auth_enabled'] = falsedisables access to the configuration of user HTTP authentication (replaces the$ALLOW_HTTP_AUTHvariable).$ZBX_FEATURE_FLAGS['modules_config_enabled'] = falsedisables access to the modules configuration.$ZBX_FEATURE_FLAGS['media_type_denylist'] = [<value1>, <value2>, ...]restricts editing of media types that use the specified delivery methods ('email','script','sms', or'webhook'; one or more values can be specified).
Access tosetup.phpis restricted if thezabbix.conf.phpconfiguration file exists.
New AllowKeyRegexp and DenyKeyRegexp parameters in Zabbix agent and Zabbix agent 2 configuration
The new AllowKeyRegexp and DenyKeyRegexp parameters have been added to the Zabbix agent and Zabbix agent 2 configuration.
These parameters allow you to define regular expression-based patterns for more precise and flexible matching of keys and their parameters.
Event details show suppression reason
The event details page, opened from Monitoring > Problems, now shows whether an event was suppressed because of host maintenance or suppressed manually by a user.
Orange icons ![]() and
and ![]() indicate maintenance-related suppression/unsuppression, while grey icons
indicate maintenance-related suppression/unsuppression, while grey icons ![]() and
and ![]() indicate manual suppression/unsuppression.
indicate manual suppression/unsuppression.
In problem and event histories, actions performed by deleted users are now shown as Inaccessible user.
Changes to the Zabbix SELinux policy package
For version 10 of AlmaLinux, CentOS Stream, RHEL, Rocky Linux, and Oracle Linux, the SELinux policy is provided by the new zabbix-selinux-policy-main package, which contains the SELinux policy from the upstream SELinux repository.
The existing zabbix-selinux-policy package now has a dependency on either zabbix-selinux-policy-main or selinux-policy-targeted-extra.
The zabbix-selinux-policy-main package conflicts with selinux-policy-targeted-extra; therefore, both packages cannot be installed at the same time.
If you have existing zabbix-selinux-policy installation, no manual changes are required.
During package upgrade, zabbix-selinux-policy-main will be installed automatically.
If selinux-policy-targeted-extra is already installed, no additional package will be installed.
Dashboard slideshow setting
When creating a dashboard, the Start slideshow checkbox is disabled by default and must be enabled explicitly.
A slideshow URL parameter supports the values on or off allowing the dashboard slideshow setting to be overridden quickly.
The slideshow=1 parameter is deprecated and will no longer be supported.
Documentation
Consolidated documentation pages for minor releases
Release documentation for minor versions of a major Zabbix release will now be collected in single documentation pages for new features and upgrade notes respectively.