
Trigger overview
Overview
The Trigger overview widget displays the current states of host triggers as a table of colored blocks. It provides a quick visual snapshot of trigger health and activity on different hosts.
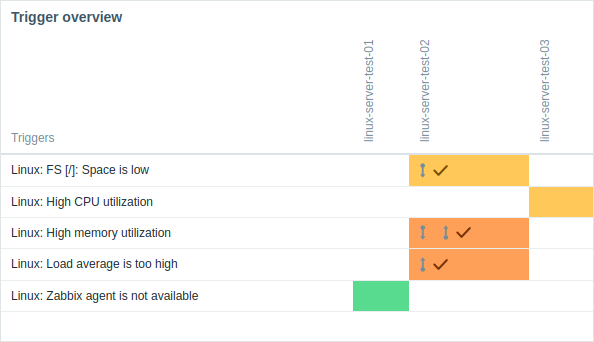
The widget uses multiple visual elements to convey trigger details:
- Block colors for PROBLEM triggers match problem severities.
- Blinking blocks indicate recent trigger state changes (within the last 2 minutes).
- Gray arrows indicate triggers with dependencies (hover over them to see details).
- Checkbox icons indicate acknowledged problems; all active or resolved problems for the trigger must be acknowledged for this icon to appear.
Trigger severity colors can be adjusted in Administration > General. Trigger severities can be modified when updating problems.
Clicking a block provides links to trigger-related information (problems, trigger configuration, etc.).
By default, up to 50 records are displayed (configurable in Administration > General > GUI under Max number of columns and rows in overview tables). If more triggers exist, a message prompts you to refine the filtering criteria. This limit is applied before any additional filtering (for example, by tags).
Configuration
To configure, select Trigger overview as type:
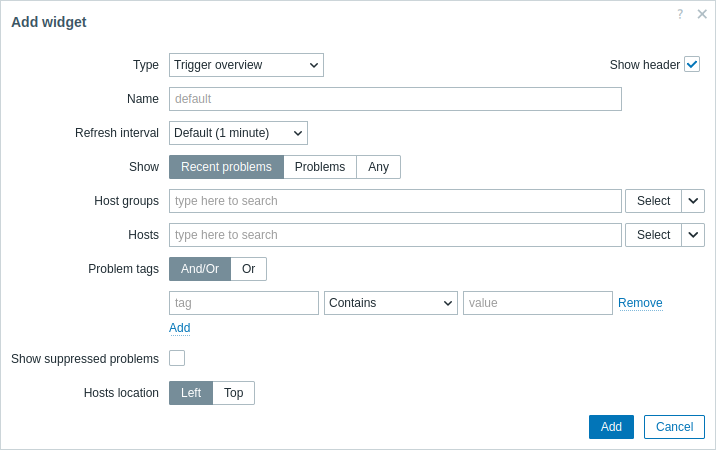
In addition to the parameters that are common for all widgets, you may set the following specific options:
| Show | Filter triggers by trigger state: Recent problems - (default) show triggers that recently have been or still are in a PROBLEM state (resolved and unresolved); Problems - show triggers that are in a PROBLEM state (unresolved); Any - show all triggers. |
| Host groups | Select host groups. Alternatively, select a compatible widget as the data source for host groups. This field is auto-complete, so starting to type the name of a group will offer a dropdown of matching groups. This parameter is not available when configuring the widget on a template dashboard. |
| Hosts | Select hosts. Alternatively, select a compatible widget or the dashboard as the data source for hosts. This field is auto-complete, so starting to type the name of a host will offer a dropdown of matching hosts. This parameter is not available when configuring the widget on a template dashboard. |
| Problem tags | Specify tags to filter the triggers displayed in the widget. It is possible to include as well as exclude specific tags and tag values. Several conditions can be set. Tag name matching is always case-sensitive. Note: If the parameter Show is set to 'Any', all triggers will be displayed even if tags are specified. However, while recent trigger state changes (displayed as blinking blocks) will update for all triggers, the trigger state details (problem severity color and whether the problem is acknowledged) will only update for triggers that match the specified tags. There are several operators available for each condition: Exists - include the specified tag names; Equals - include the specified tag names and values (case-sensitive); Contains - include the specified tag names where the tag values contain the entered string (substring match, case-insensitive); Does not exist - exclude the specified tag names; Does not equal - exclude the specified tag names and values (case-sensitive); Does not contain - exclude the specified tag names where the tag values contain the entered string (substring match, case-insensitive). There are two calculation types for conditions: And/Or - all conditions must be met, conditions having the same tag name will be grouped by the Or condition; Or - enough if one condition is met. |
| Show suppressed problems | Mark the checkbox to display problems that would otherwise be suppressed (not shown) because of host maintenance. |
| Layout | Select the layout option: Horizontal - host names will be displayed on the left; Vertical - host names will be displayed at the top. |