
Latest data
Overview
The Monitoring > Latest data section displays the latest values gathered by items.
This section contains the following elements:
The subfilter and item list is displayed only if the filter is set and there are results to display.
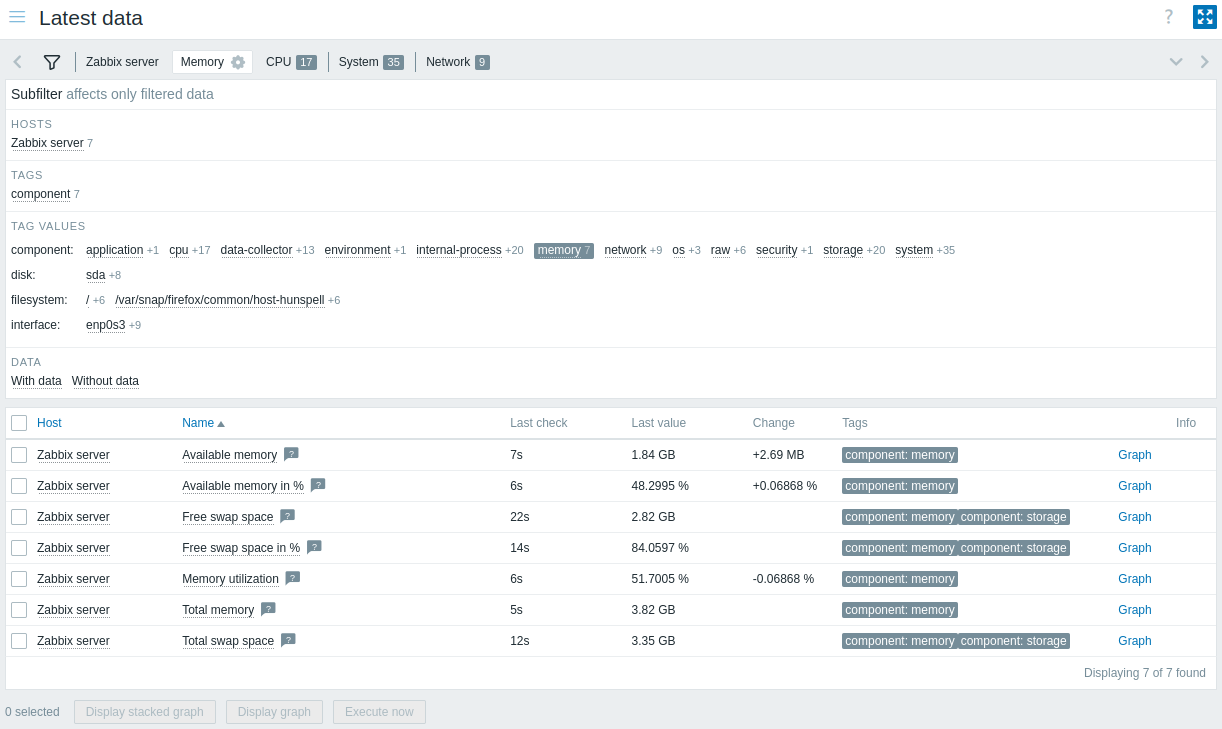
Latest value details are displayed in a customizable table.
The  Customize table button in the table header lets you show, hide, or reorder columns, and reset the layout to default.
You can also resize each column by dragging its right border; double-click the border to reset.
All customizations are applied immediately and always remembered for the current user within the active filter tab (default or saved).
Customize table button in the table header lets you show, hide, or reorder columns, and reset the layout to default.
You can also resize each column by dragging its right border; double-click the border to reset.
All customizations are applied immediately and always remembered for the current user within the active filter tab (default or saved).
The following columns are available:
| Column | Description |
|---|---|
| Host | Name of the host to which the item belongs. Clicking the name brings up the host context menu. If a host is in maintenance, an orange wrench If a host is disabled, the name of the host is displayed in red. Note that data of disabled hosts (including graphs and item value lists) is accessible in the Latest data section. |
| Name | Name of the item. Clicking the name brings up the item menu. A question mark Clicking the  Options button in the column header gives you access to the Show item key option that displays the item key below each item's name. Options button in the column header gives you access to the Show item key option that displays the item key below each item's name. |
| Interval | Update interval of the item. |
| History | History storage period of the item. |
| Trends | Trends storage period of the item. |
| Type | Type of the item. |
| Last check | Time since the last item check. |
| Last value | Most recent value for the item. Values are displayed with unit conversion and value mapping applied. Hover over the value to display raw data (truncated to 8192 characters). Binary values are displayed as a placeholder (binary value) instead of the actual value. By default, only values received in the last 24 hours are displayed. This limit improves initial loading times for large pages of latest data; to extend it, update the value of the Max history display period parameter in Administration > General > GUI. |
| Change | Difference between the previous value and the most recent value. For items with an update frequency of 1 day or more, the change amount will never be displayed (with the default setting). In this case, the last value will not be displayed at all if it was received more than 24 hours ago. |
| Tags | Tags associated with the item. Clicking a tag enables it in the subfilter, thus filtering the item list by that tag (and any other tags selected in the subfilter). Once clicked, such tags are no longer clickable; to adjust filtering by tags, the subfilter must be used. Clicking the Options button in the column header lets you set the number of tags displayed (1-3), choose how tag names are displayed (full, shortened, or none), set tag display priority, or duplicate the column (duplicated columns can be renamed or deleted). |
| Tag value | Item tag values are displayed. Clicking the Options button in the column header lets you rename the column, choose which tag values to display, or duplicate the column (duplicated columns can be renamed or deleted). |
| Actions | Link to simple graph/history of item values. |
| Info | Additional information about the item. If an item has errors (for example, has become unsupported), an information |
| Custom text | Custom text, macro values, or a combination of both is displayed. Clicking the Options button in the column header lets you rename the column, enter the custom text or macros, or duplicate the column (duplicated columns can be renamed or deleted).Supported macros: {HOST.*} (except {HOST.METADATA}), {INVENTORY.*}, {ITEM.*} (except {ITEM.STATE.ERROR}), and user macros. |
Buttons
View mode buttons being common for all sections are described on the Monitoring page.
Mass actions
Buttons below the list offer mass actions with one or several selected items:
- Display stacked graph - display a stacked ad-hoc graph.
- Display graph - display a simple ad-hoc graph.
- Execute now - execute a check for new item values immediately. Supported for passive checks only (see more details). This option is available only for hosts with read-write access. Accessing this option for hosts with read-only permissions depends on the user role option called Invoke "Execute now" on read-only hosts.
To use these options, mark the checkboxes before the respective items, then click the required button.
Using filter
You can use the filter to display only the items you are interested in. For better search performance, data is searched with macros unresolved.
The filter ![]() icon is located above the item list and the subfilter.
Click it to expand the filter.
icon is located above the item list and the subfilter.
Click it to expand the filter.
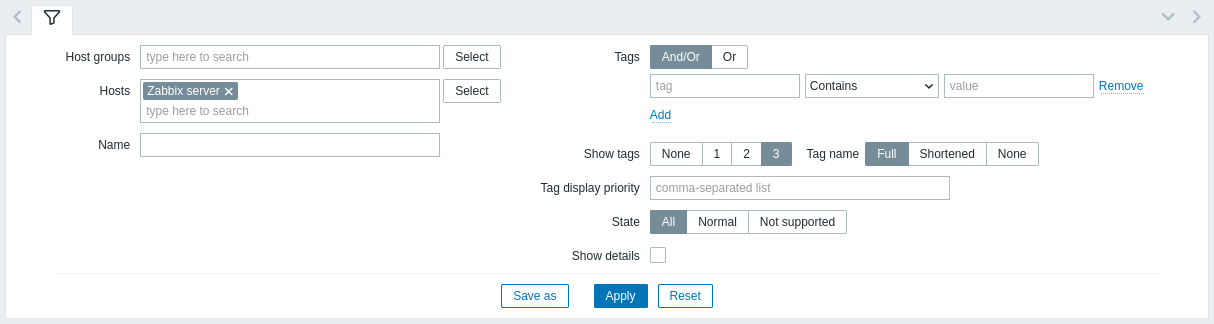
The filter allows to narrow the item list by host group, host, item name, tags, and state. Specifying a parent host group in the filter implicitly selects all nested host groups. See Monitoring > Problems for details on filtering by tags.
The Show details filter option allows to extend the information displayed for the items. Mark it to display such details as the item refresh interval, history and trends settings, item type, and item errors (fine/unsupported).
Saving filter
Favorite filter settings can be saved as tabs and then quickly accessed by clicking the respective tab above the filter.
See more details about saving filters.
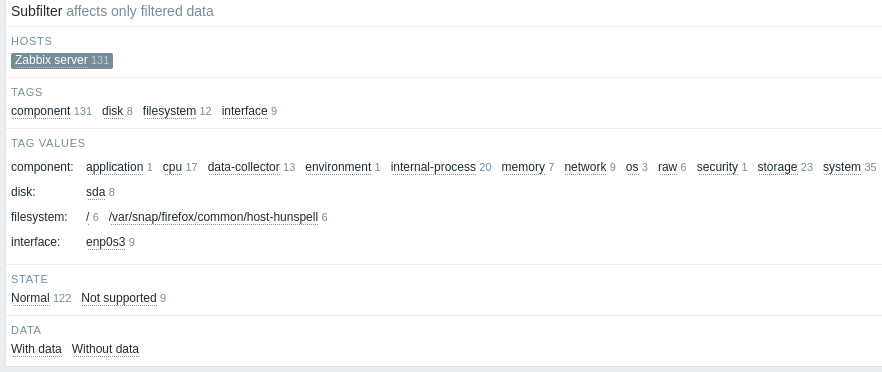
Using subfilter
The subfilter allows to further modify the filtering from the main filter.
It contains clickable links for a quick access to related items. Items are related by common entity - host, tag name or value, item state, or data status. When an entity is clicked, the entity is highlighted with a gray background, and items are immediately filtered (no need to click Apply in the main filter). Clicking another entity adds it to the filtered results. Clicking the entity again removes the filtering.
Subfilters are generated based on the filtered data, which is limited to 1000 records. If there are 20 hosts each having 100 items (so 2000 records in total), only half of the hosts will be visible in the subfilter. If you want to see more records in the subfilter, you need to increase the value of Limit for search and filter results parameter (in Administration > General > GUI).
Unlike the main filter, the subfilter is updated with each table refresh request to always have up-to-date information of available filtering options and their counter numbers.
For each entity group (hosts, tags, tag values, etc.), up to 10 rows of entities are displayed.
If there are more entities, this list can be expanded to display a maximum of 1000 entries (the value of SUBFILTER_VALUES_PER_GROUP in frontend definitions) by clicking the three-dot ![]() icon at the end of the list.
For Tag values, the list can be expanded to display a maximum of 200 tag names with their corresponding values.
Note that once fully expanded, the list cannot be collapsed.
icon at the end of the list.
For Tag values, the list can be expanded to display a maximum of 200 tag names with their corresponding values.
Note that once fully expanded, the list cannot be collapsed.
A number next to each clickable entity indicates the number of items grouped in it (based on the results of the main filter). When an entity is clicked, the numbers with other available entities are displayed with a plus sign indicating how many items may be added to the current selection. Entities without items are not displayed unless selected in the subfilter before.
Graphs and history
The Graph/History column in the item list offers the following links:
- History - for all textual items, leading to listings (Values/500 latest values) displaying the history of previous item values.
- Graph - for all numeric items, leading to a simple graph. Note that when the graph is displayed, a dropdown on the upper right offers a possibility to switch to Values/500 latest values as well.
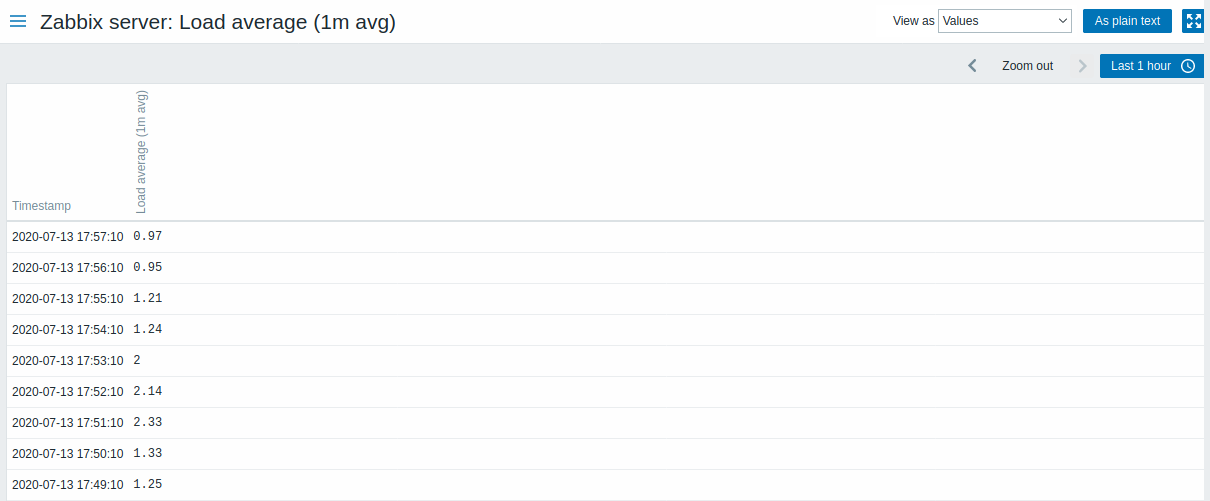
The values displayed in this list are raw, that is, no postprocessing is applied.
The total amount of values displayed is defined by the value of Limit for search and filter results parameter, set in Administration > General > GUI.