Real-life scenario
Overview
This section presents a step-by-step real-life example of how web monitoring can be used.
Zabbix web monitoring will be used to monitor Zabbix frontend. The goal is to determine if it is available, provides the right content, and how quickly it works. To achieve this, several steps are required, including checking the availability of the first page, logging in with a username and password, verifying the login success, logging out, and confirming the logout.
Scenario
Add a new web scenario
- Go to Data collection > Hosts.
- Choose a host and click Web in the row of that host.
- Click Create web scenario.
-
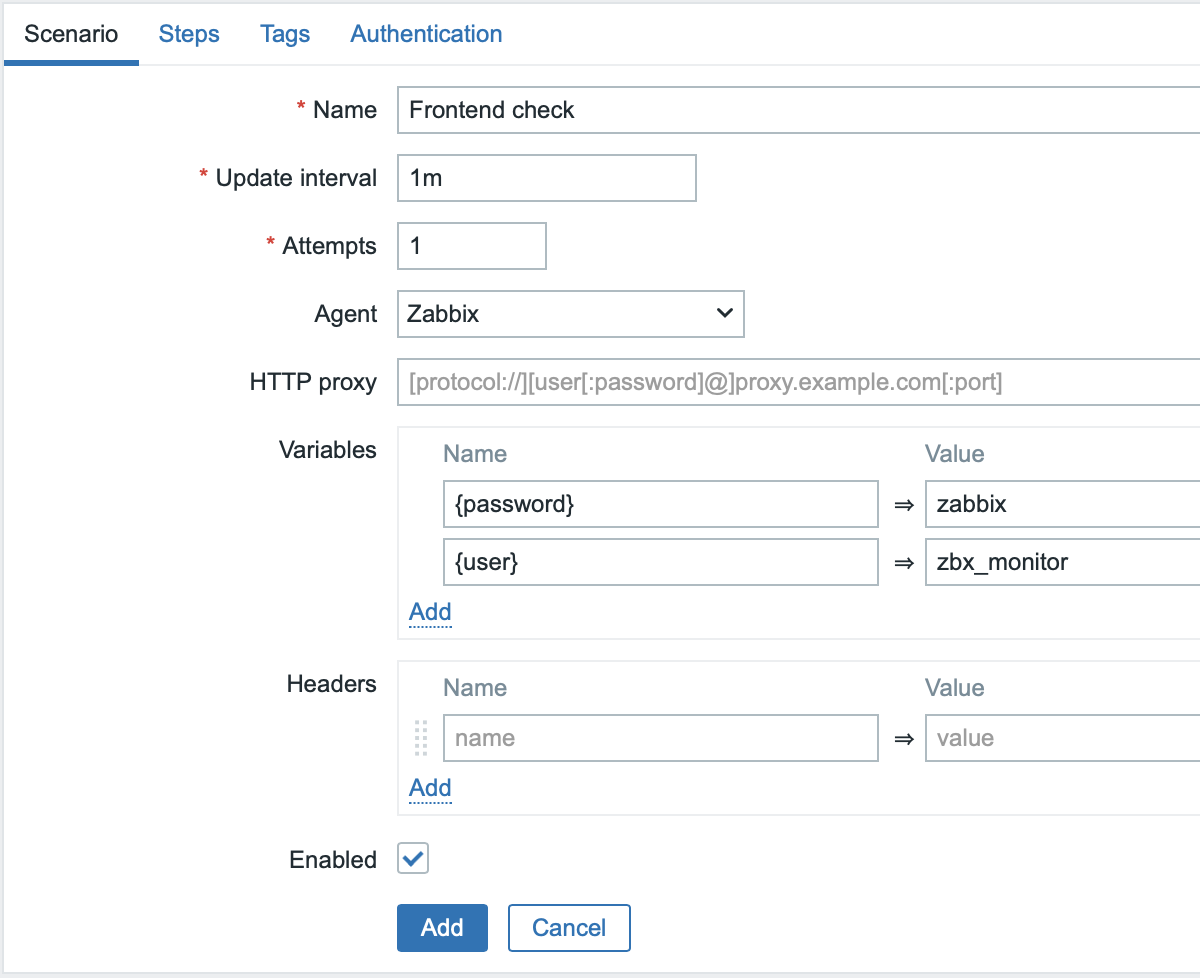
In the new scenario form, on the Scenario tab, fill out the following fields:
- Name: Frontend check.
- Update interval: 1m.
- Attempts: 1.
- Agent: Zabbix.
In the Variables section, add the following name-value pairs: {user}: your existing Zabbix user credentials;{password}: your existing Zabbix user credentials.
For safety reasons, it is recommended to create a separate user with minimal permissions to use for monitoring purposes.
Optionally, switch to the Tags tab and add web scenario tags.
You can use web scenario tags to quickly identify related items and triggers or search through collected data.
For example, suitable tags for this tutorial are component: web-scenario and/or target: frontend.
Configure web scenario steps
Switch to the Steps tab and define steps for the scenario.
After configuring each step, click the Add button.
Note that Zabbix frontend uses JavaScript redirect when logging in, so login must occur first, and logged-in features can be checked only in further steps. Additionally, the login step must use the full URL to index.php file.
Common fields for all steps
In addition to the step-specific fields, fill out the following common fields for each step described below:
- URL: the URL of the Zabbix frontend (
http://<server_ip_or_name>/zabbix/index.php(for Apache) orhttp://<server_ip_or_name>/index.php(for NGINX)). For Web scenario step 3, use a different URL as described below. - Timeout: 15s.
- Required status codes: 200.
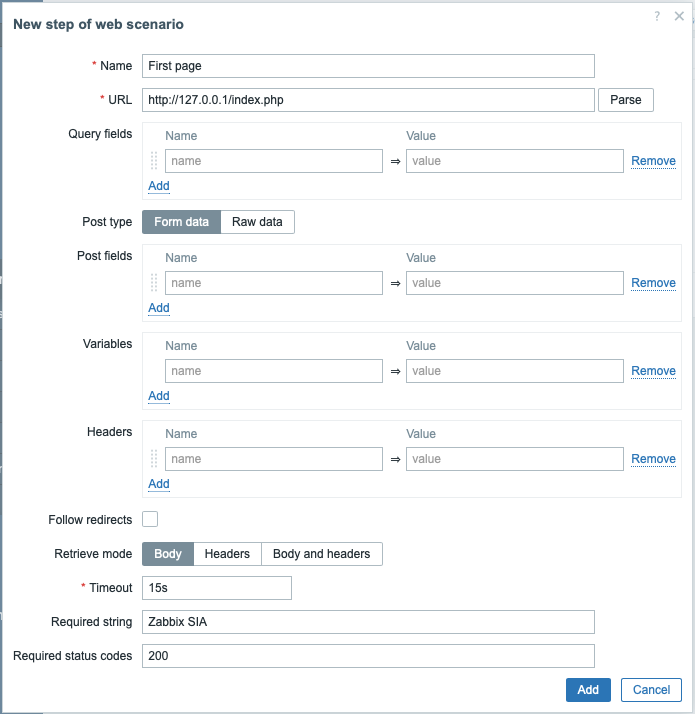
Web scenario step 1
Check that the first page responds correctly, returns HTTP status code 200, and contains the text Zabbix SIA.
Fill out the following fields:
- Name: First page.
- Timeout: 15s.
- Required string: Zabbix SIA.
- The common fields for all steps.
Web scenario step 2
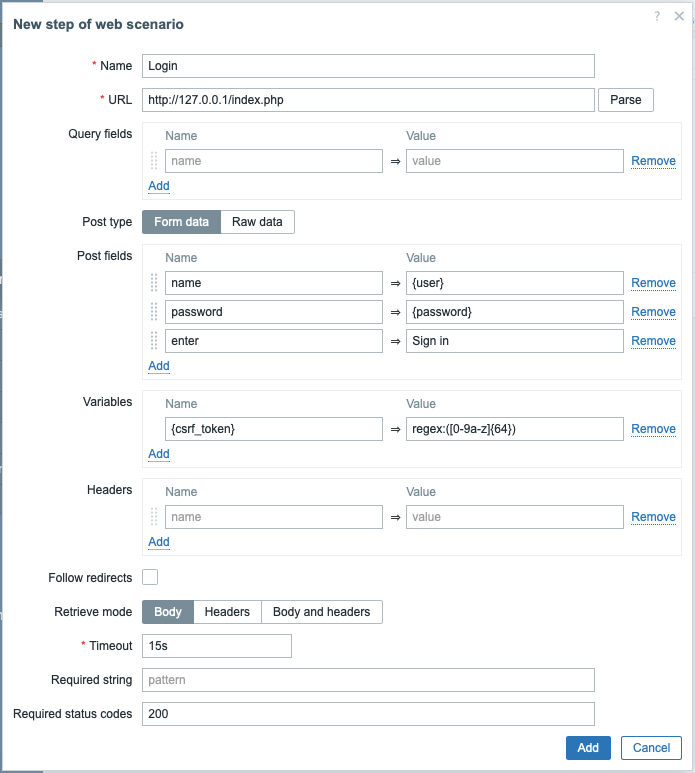
Log in to the Zabbix frontend using the macros (variables) defined in the Scenario tab: {user} and {password}.
Fill out the following fields:
- Name: Login.
- In the Post fields section, add the following name-value pairs:
- name:
{user}; - password:
{password}; - enter: Sign in.
- name:
- The common fields for all steps.
Select the Follow redirects checkbox.
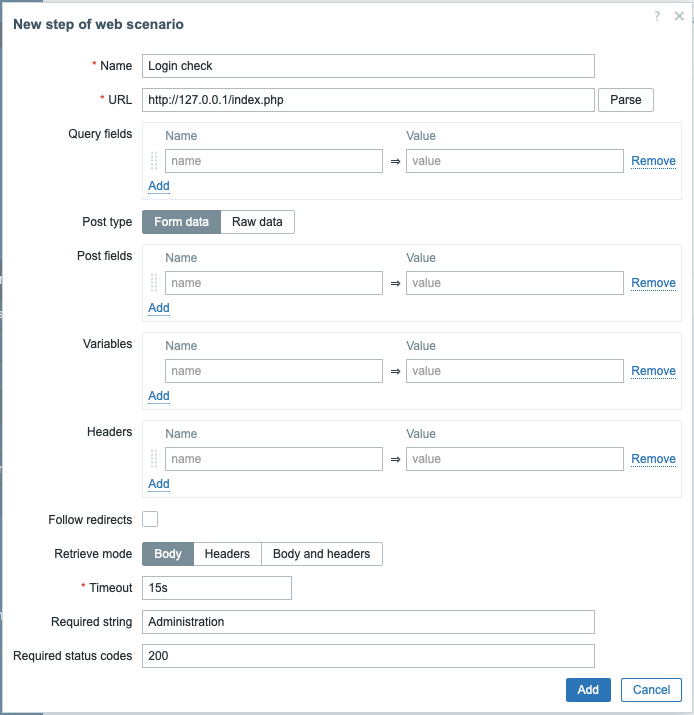
Web scenario step 3
After logging in, verify success by checking for a string visible only when logged in, for example, Administration.
Fill out the following fields:
- Name: Login check.
- URL: the URL to which the user is redirected after login (for example, http://127.0.0.1/zabbix/zabbix.php?action=dashboard.view).
- In the Variables section, add the name-value pair
{csrf_token}:regex:([0-9a-z]{64}). This variable will catch the value of the assigned CSRF token to reuse in the web scenario step 4. - Required string: Administration.
- The common fields for all steps.
Web scenario step 4
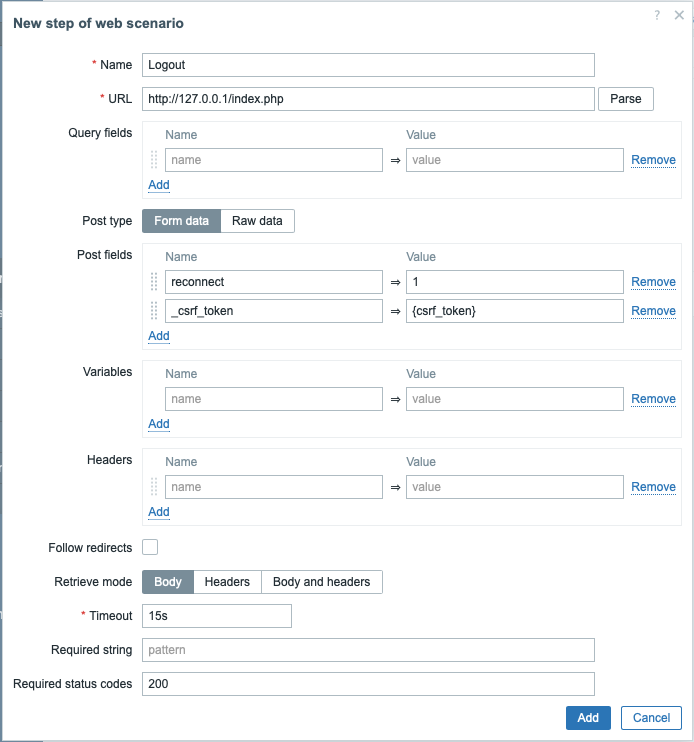
Once the frontend's accessibility and login have been verified, add a logout step; otherwise, the Zabbix database will become cluttered with many open session records.
Fill out the following fields:
- Name: Logout.
- In the Post fields section, add the following name-value pairs:
- reconnect: 1;
- _csrf_token:
{csrf_token}.
- The common fields for all steps.
Select the Follow redirects checkbox.
This step uses the variable {csrf_token} obtained in the web scenario step 3.
Web scenario step 5
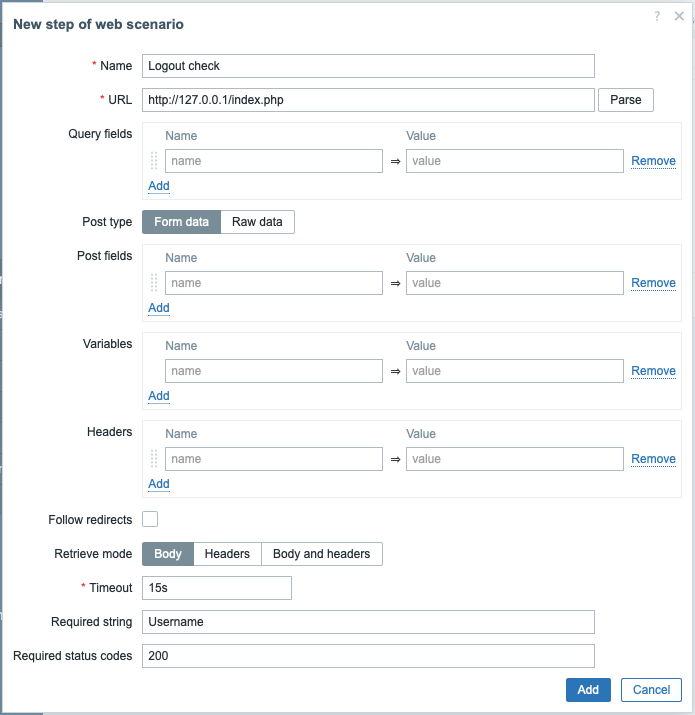
To confirm the logout, check for the Username string.
Fill out the following fields:
- Name: Logout check.
- Required string: Username.
- The common fields for all steps.
Full configuration of steps
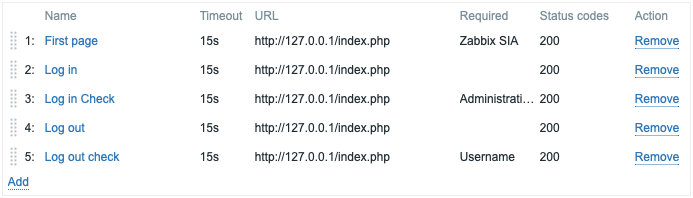
A complete configuration of web scenario steps should look like this:
Check the results
Save the finished web monitoring scenario.
When the web scenario is created, new web monitoring items are automatically added for monitoring.
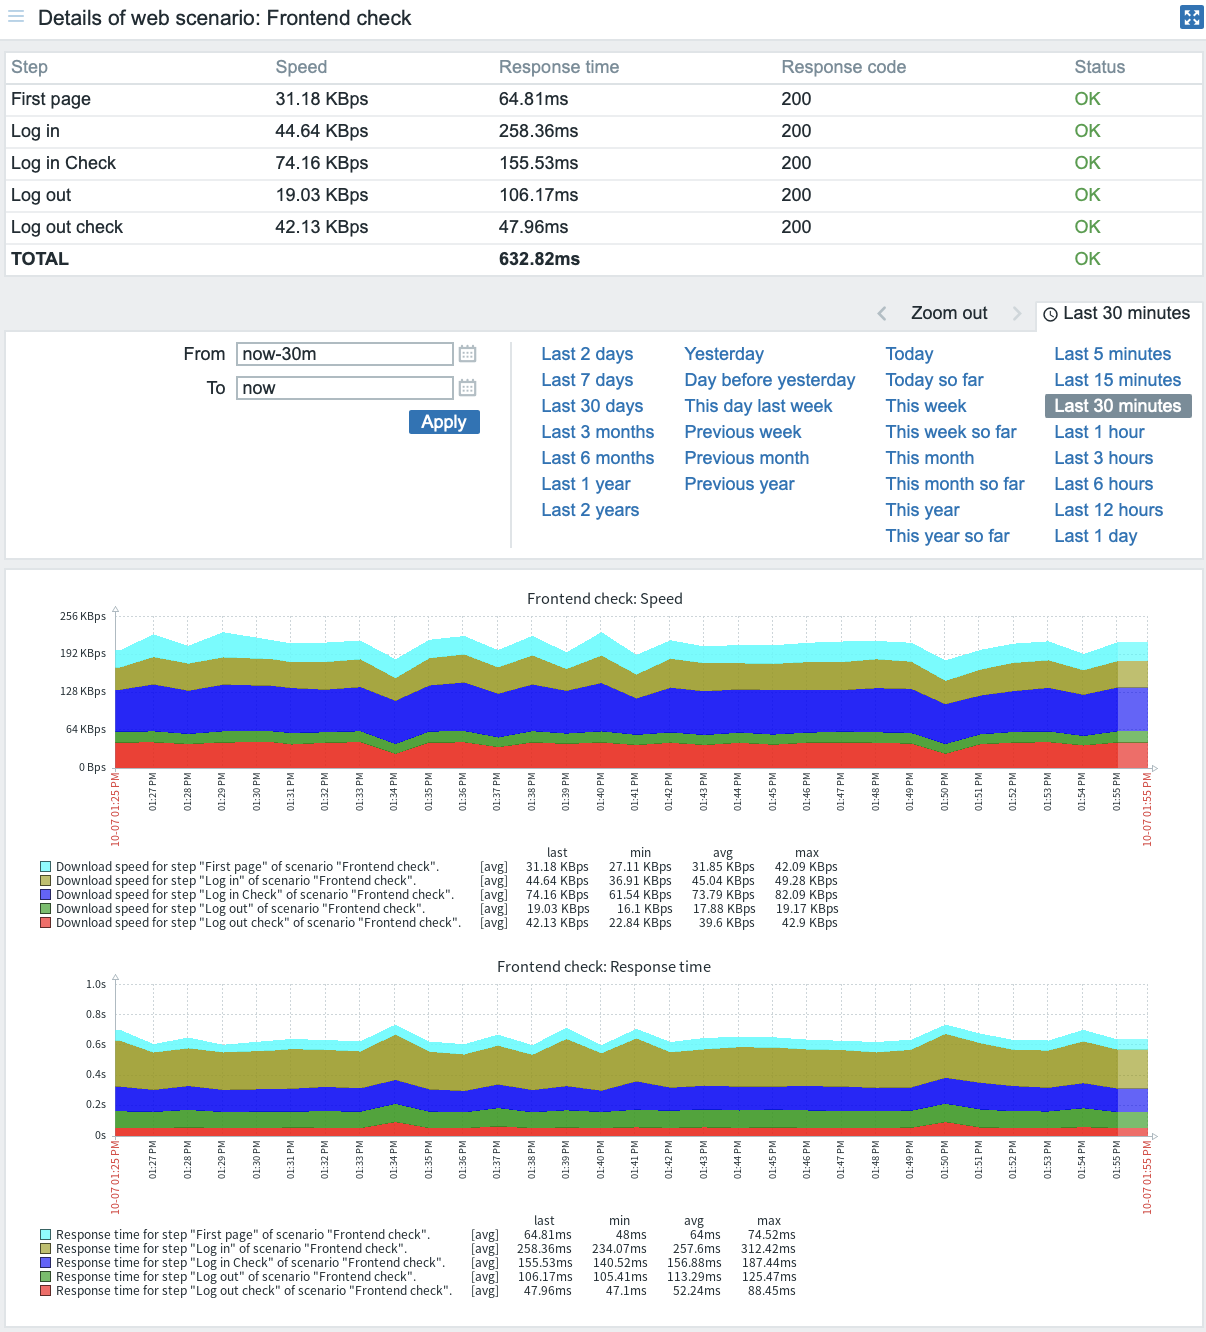
The scenario will be added to the host. To view web scenario information go to Monitoring > Hosts, locate the host in the list and click the Web hyperlink in the last column.

Click the scenario name to see detailed statistics: