
17 Prometheus 检查
概述
Zabbix 可以 query 以 Prometheus 行格式暴露的指标。
要开始收集 Prometheus 数据,需要完成两个步骤:
- 一个指向适当数据端点的 HTTP master item,例如:
https://<prometheus host>/metrics - 使用 Prometheus 预处理选项的依赖 监控项,以从主控 监控项 收集的指标中 query 所需数据
目前有两种 Prometheus 数据预处理选项:
- Prometheus 模式 - 用于普通 监控项 中的 Prometheus 数据 query
- Prometheus 转 JSON - 用于普通 监控项 和低级别自动发现。在这种情况下,查询的 Prometheus 数据将以 JSON 格式返回。
批量处理
对于依赖的 监控项,支持批量处理。要启用缓存和索引,
Prometheus模式预处理必须是第一个预处理步骤。
当Prometheus模式是第一个预处理步骤时,则解析的Prometheus
数据由第一个<label>==<value>条件进行缓存和索引
Prometheus模式预处理步骤。处理时会重复使用此缓存
本批次中的其他依赖项 监控项。为获得最佳性能,第一个标签
应为具有最多不同值的项。
如果在第一步之前还有其他预处理需要完成,则应进行这些预处理。 移动到主 监控项 或新的从属 监控项,该从属将被用作 主监控项用于从属监控项。
配置
若已配置HTTP主监控项,您需要create一个采用Prometheus预处理步骤的dependent item:
- 在配置表单中输入常规依赖监控项参数
- 转到预处理选项卡
- 选择Prometheus预处理选项(Prometheus模式或Prometheus转JSON)
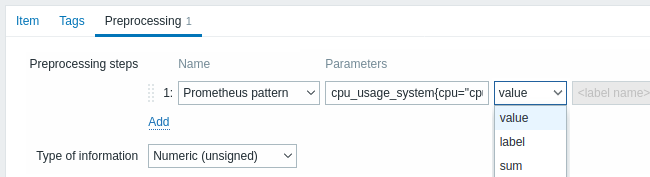
以下参数为Prometheus模式预处理选项特有:
| 参数 | 描述 | 示例 |
|---|---|---|
| Pattern | 定义数据模式时,可使用类似Prometheusquery语言的query语言(参见对比表),例如: <metric name> - 按指标名称选择 {__name__="<metric name>"} - 按指标名称选择 {__name__=\~"<regex>"} - 按匹配正则表达式的指标名称选择 {<label name>="<label value>",...} - 按标签名称选择 {<label name>=\~"<regex>",...} - 按匹配正则表达式的标签名称选择 {__name__=\~".*"}==<value> - 按指标值选择 或组合使用上述语法: <metric name>{<label1 name>="<label1 value>",<label2 name>=\~"<regex>",...}==<value> 标签值可以是任意UTF-8字符序列,但反斜杠、双引号和换行符必须分别转义为 \\、\"和\n;其他字符不应转义。 |
wmi_os_physical_memory_free_bytes cpu_usage_system{cpu="cpu-total"} cpu_usage_system{cpu=\~".*"} cpu_usage_system{cpu="cpu-total",host=\~".*"} wmi_service_state{name="dhcp"}==1 wmi_os_timezone{timezone=\~".*"}==1 |
| Result processing | 指定返回数值、标签或应用聚合函数(若模式匹配多行): value - 返回指标值(匹配多行时报错) label - 返回Label字段指定标签的值(匹配多个指标时报错) sum - 返回值总和 min - 返回最小值 max - 返回最大值 avg - 返回平均值 count - 返回值计数 此字段仅适用于Prometheus模式选项。 |
参见下方参数使用示例。 |
| Output | 定义标签名称(可选)。选择后将返回对应标签的值。 此字段仅在Prometheus模式选项的Result processing字段选择'Label'时可用。 |
参数使用示例
- 最常见用例是返回value。要从以下数据返回
/var/db的值:
node_disk_usage_bytes{path="/var/cache"} 2.1766144e+09
node_disk_usage_bytes{path="/var/db"} 20480
node_disk_usage_bytes{path="/var/dpkg"} 8192
node_disk_usage_bytes{path="/var/empty"} 4096
使用以下参数:
- Pattern -
node_disk_usage_bytes{path="/var/db"} - Result processing - 选择'value'
- 您可能还需要获取所有
node_disk_usage_bytes参数的平均值:
- Pattern -
node_disk_usage_bytes - Result processing - 选择'avg'
- 虽然Prometheus仅支持数值数据,但常用变通方法返回文本描述。通过过滤器指定标签可实现此功能。要从以下数据返回'color'标签的值:
elasticsearch_cluster_health_status{cluster="elasticsearch",color="green"} 1
elasticsearch_cluster_health_status{cluster="elasticsearch",color="red"} 0
elasticsearch_cluster_health_status{cluster="elasticsearch",color="yellow"} 0
使用以下参数:
- Pattern -
elasticsearch_cluster_health_status {cluster="elasticsearch"} == 1 - Result processing - 选择'label'
- Label - 指定'color'
基于数值'1'的过滤器将匹配对应行,而标签将返回健康状态描述(当前为'green';也可能为'red'或'yellow')。
Prometheus 转 JSON
来自Prometheus的数据可用于低级别自动发现。在这种情况下,需要JSON格式的数据,并且使用Prometheus到JSON预处理选项将正好返回这种格式的数据。
有关更多详细信息,请参见 Discovery using Prometheus data。
query 语言对比
下表列出了 PromQL 与 Zabbix Prometheus 预处理 query 语言之间的差异和相似之处。
| PromQL instant vector selector | Zabbix Prometheus 预处理 | |
|---|---|---|
| 差异 | ||
| query 目标 | Prometheus 服务器 | Prometheus 暴露格式中的纯文本 |
| 返回值 | 即时向量 | 指标或标签值(Prometheus 模式) array 单个 JSON 值的指标(Prometheus 转 JSON) |
| 标签匹配运算符 | =, !=, =\~, !\~ | =, !=, =\~, !\~ |
| 在标签或指标名称匹配中使用的正则表达式 | RE2 | PCRE |
| 比较运算符 | 参见 list | 仅支持 ==(等于)用于值过滤 |
| 相似之处 | ||
| 通过等于 string 的指标名称进行选择 | <metric name> 或 {__name__="<metric name>"} | <metric name> 或 {__name__="<metric name>"} |
| 通过匹配正则表达式的指标名称进行选择 | {__name__=\~"<regex>"} | {__name__=\~"<regex>"} |
| 通过等于 string 的 <label name> 值进行选择 | {<label name>="<label value>",...} | {<label name>="<label value>",...} |
| 通过匹配正则表达式的 <label name> 值进行选择 | {<label name>=\~"<regex>",...} | {<label name>=\~"<regex>",...} |
| 通过等于 string 的值进行选择 | {__name__=\~".*"} == <value> | {__name__=\~".*"} == <value> |