
Monitor a network switch or router with Zabbix
Introduction
This guide walks you through the steps required to start basic monitoring of your network switch or router using Zabbix. A Cisco router is used as an example, but the procedure applies to any SNMP-enabled network device.
Who this guide is for
This guide is designed for new Zabbix users and network administrators who want to quickly enable basic monitoring for network devices. If you require deep customization or advanced configuration options, please refer to the SNMP agent page or the Configuration section of Zabbix manual.
Prerequisites
Before proceeding with this guide, ensure that you have:
- Zabbix server and Zabbix frontend installed: install according to the instructions for your operating system (see Installation from packages and Web interface installation).
- Zabbix agent installed if monitoring local network metrics.
- SNMP-enabled device: a network switch or router (for example, a Cisco router) with SNMP enabled.
- MIB files installed: Installing MIB files enables Zabbix to translate numeric OIDs into human‐readable names and descriptions. Without proper MIB support, you may see only numeric values, making it harder to configure items and troubleshoot issues.
To install MIB files on Ubuntu:
1. Install the MIB downloader package:
sudo apt-get update
sudo apt-get install snmp-mibs-downloader
If you need to add vendor-specific MIBs (e.g., from Cisco, Juniper), place them in the appropriate MIB directory:
- For Linux-based systems common locations include
/usr/share/snmp/mibs/or/usr/local/share/snmp/mibs/. - For Zabbix installations MIB files can be stored in
/var/lib/zabbix/mibs/.
Ensure the MIBDIRS environment variable or the snmp.conf file includes the correct path.
To verify that your system recognizes the new MIBs, use:
snmptranslate -IR -On <MIB-NAME>::<object>For detailed instructions, refer to your SNMP library documentation:
2. Edit /etc/snmp/snmp.conf and comment out the line that starts with mibs : to allow the system to load all available MIBs.
3. Verify by running an snmpwalk (for example, snmpwalk -v 2c -c <your_community_string> <device_IP>) and check that OIDs are displayed with descriptive names.
Depending on your environment, some steps in this guide may slightly differ. This guide is based on an environment running Ubuntu and a Cisco Catalyst 3750V2-24FS network device being monitored.
It is assumed that your network device is already physically installed and connected.
Configure the network device (Cisco router example)
For monitoring via SNMP, you must configure your network device to allow SNMP queries. The example below is for SNMPv2 and does not take into account existing settings. Caution: applying these commands may override current SNMP configurations.
For a Cisco router, the configuration typically involves steps written below.
SNMPv2 Example
1. Enable SNMP and set community string.
Log in to your Cisco router's console and enter configuration mode:
configure terminalThen, enable SNMP by specifying a read-only community string. For example:
snmp-server community <your_community_string> ROReplace <your_community_string> with your secure community string.
Note: the RO (Read-Only) option allows SNMP to retrieve data from the device but prevents any configuration changes.
It is recommended to restrict SNMP access to only the necessary devices for security reasons. For further guidance on configuring access control lists (ACLs), refer to Cisco's official documentation.
2. Save the configuration.
Save your changes to ensure SNMP settings persist after a reboot:
write memorySNMPv3 Example
SNMPv3 provides enhanced security with authentication and encryption. Its configuration is more secure than SNMPv2 and should be verified against your device-specific documentation.
1. Create an SNMP group.
Configure an SNMPv3 group with privacy (encryption) enabled:
configure terminal
snmp-server group <your_group> v3 priv
2. Create an SNMP user.
Add an SNMPv3 user with authentication and privacy. Replace the placeholders with your desired values:
snmp-server user <your_user> <your_group> v3 auth md5 <auth_password> priv aes 128 <priv_password>3. Save the configuration:
write memoryFor further details or model-specific instructions, you may refer to external Cisco SNMP configuration tutorials. This guide, however, provides the basic steps for enabling SNMP monitoring.
Configure Zabbix frontend
Create a host in Zabbix frontend
1. Log into Zabbix frontend.
2. Add a new host.
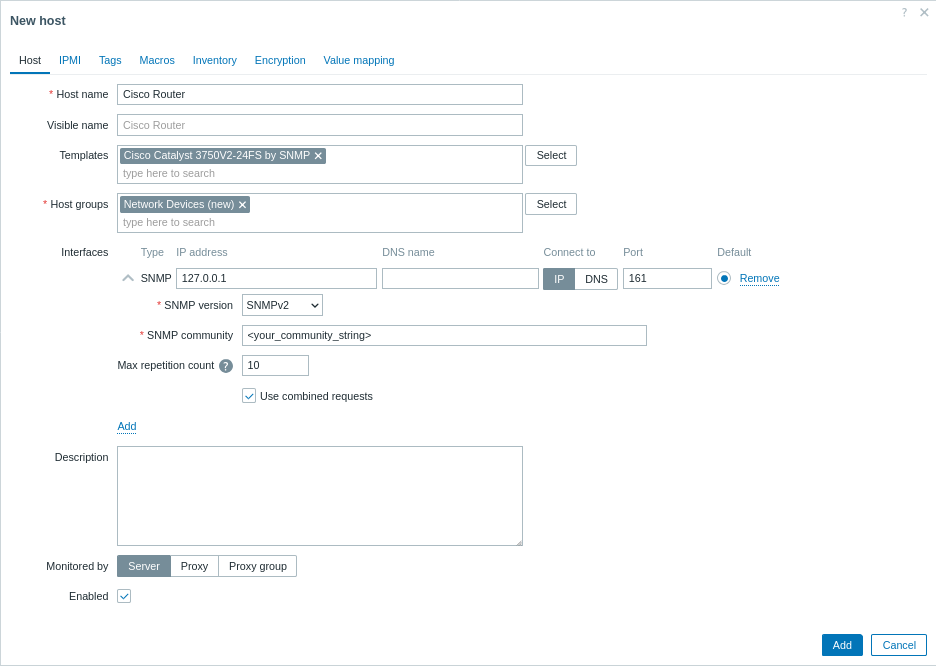
Navigate to Data collection > Hosts and click Create host.
- Host name: enter a name for your device (e.g., "Cisco Router").
- Host groups: select an existing group or create a new group such as "Network Devices".
- Interfaces:
- Click Add under Interfaces.
- Choose SNMP as the interface type.
- Enter the IP address or DNS name of your Cisco router.
- Set the default SNMP port (usually 161).
- Use the drop-down menu to select the appropriate SNMP version (e.g., SNMPv2).
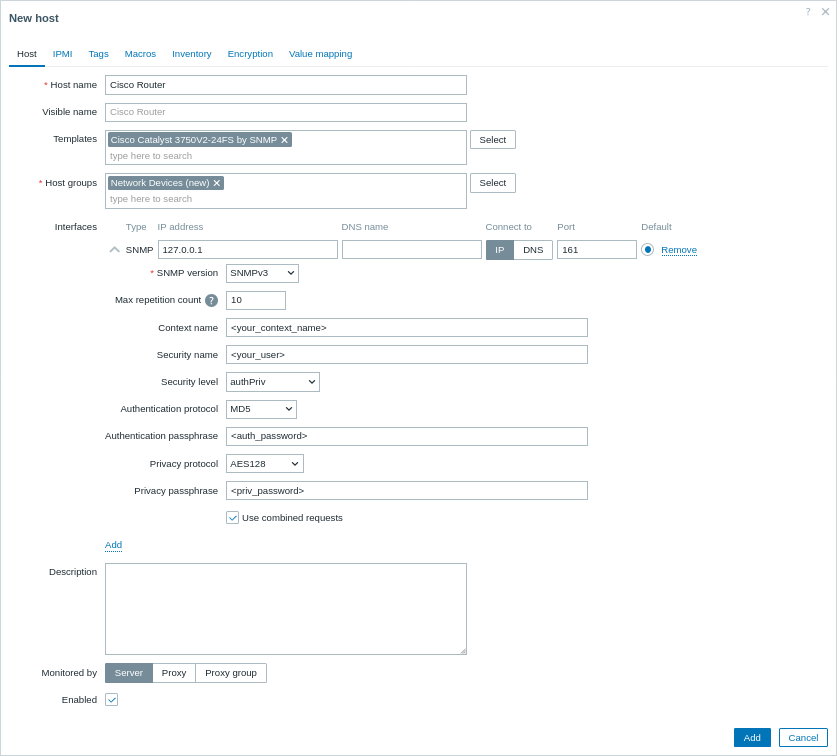
- For SNMPv1/v2, enter the community string in the SNMP community field. For SNMPv3, additional credentials (Context name, Security name, and Security level, etc.) will be prompted.
3. Link Templates
In the Templates field, select the SNMP template that best matches your device. Zabbix provides a range of pre-built SNMP templates for many device families. For example, if you are monitoring a Cisco device, choose the template that corresponds to your device's OS or model (such as Cisco IOS SNMP or Cisco Catalyst 3750<device model> SNMP).
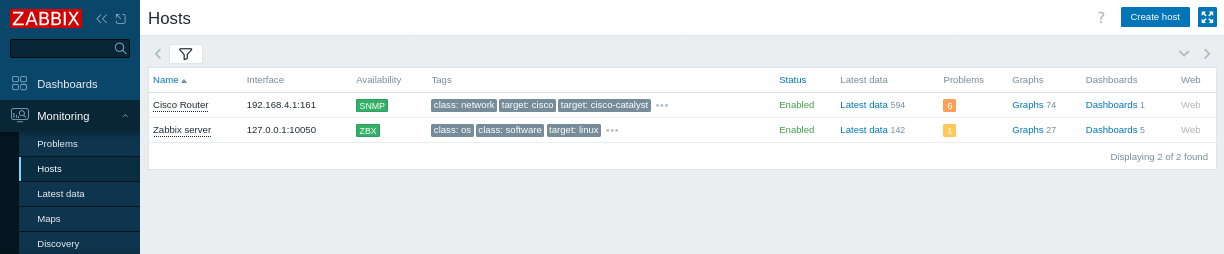
4. Click Add to save the host.
View collected metrics
Congratulations! Zabbix is now set up to monitor your network device.
Latest Data:
- Navigate to Monitoring > Latest data in the Zabbix frontend.
- Select your "Cisco Router" host (or discovered hosts) to view metrics such as hardware and network uptime, ICMP loss, ping, and response time, etc.
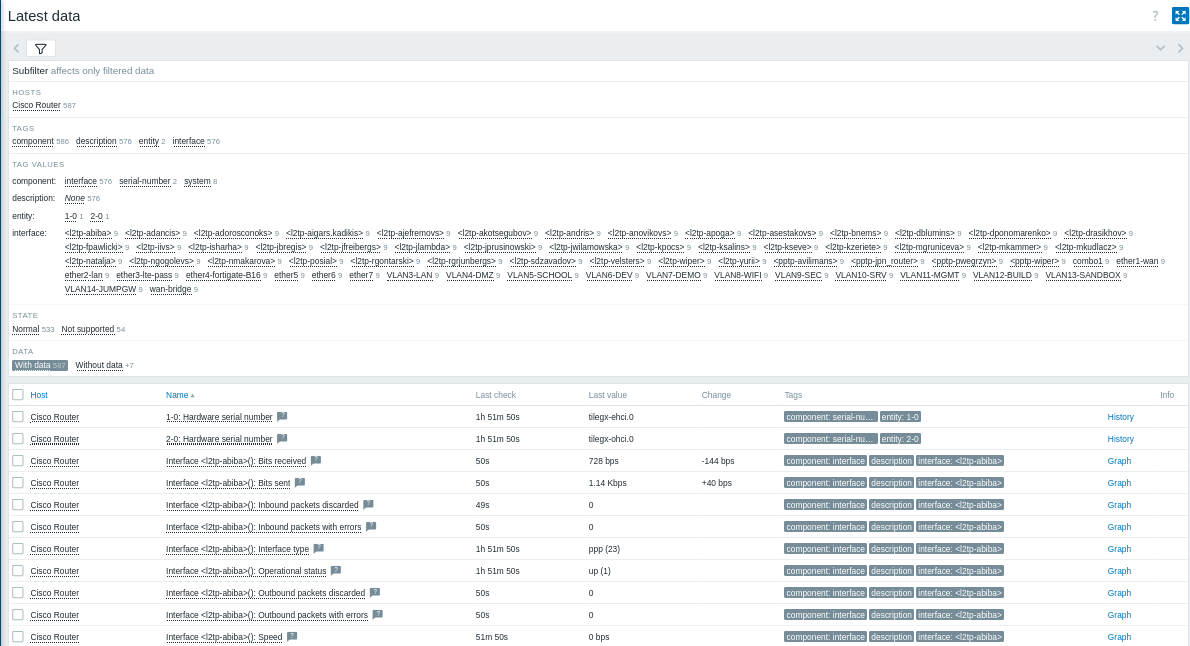
- Graphs and screens:
To visualize the performance data, click Graphs next to the SNMP items to see detailed metrics.
As a next step, you can:
- Add custom SNMP items to monitor additional metrics.
- Set up problem alerts to receive notifications about potential issues.
Create SNMP items
Once the host is set up, you can create items to monitor specific metrics. Note: this step is optional if you're using a template, as templates already contain default sets of items.
1. Identify the SNMP OID:
Use the snmpwalk command to list available OIDs on your device.
For example:
snmpwalk -v 2c -c <your_community_string> <device_IP> .Find the OID for the metric you wish to monitor (for instance, IF-MIB::ifHCInOctets.3 for incoming traffic on port 3). To get the numeric OID, you can use:
snmpget -v 2c -c <your_community_string> -On <device_IP> IF-MIB::ifHCInOctets.32. Create an SNMP item:
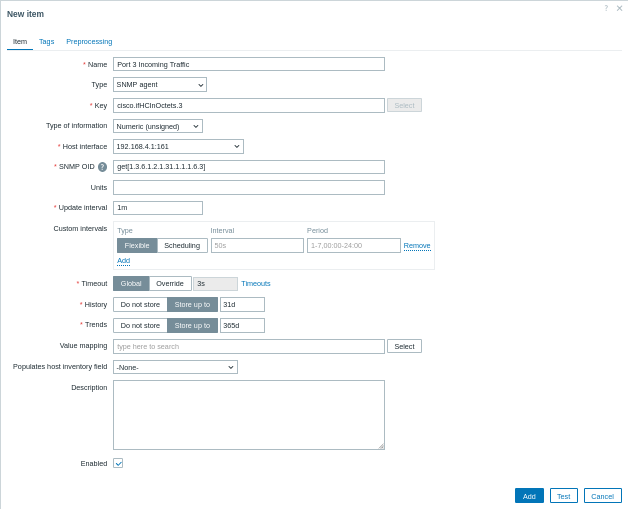
- Navigate to Data collection > Hosts and click the Items tab for your SNMP host and click Create item.
- Name: enter a descriptive name (e.g., "Port 3 Incoming Traffic").
- Type: select SNMP agent.
- Key: provide a meaningful key (e.g.,
cisco.ifHCInOctets.3). - Host interface: ensure the SNMP interface is selected.
- SNMP OID: enter the OID using one of the supported formats, for example:
get[1.3.6.1.2.1.31.1.1.1.6.3]for a single value;walk[1.3.6.1.2.1.31.1.1.1.6.3]to retrieve a subtree of values asynchronously.
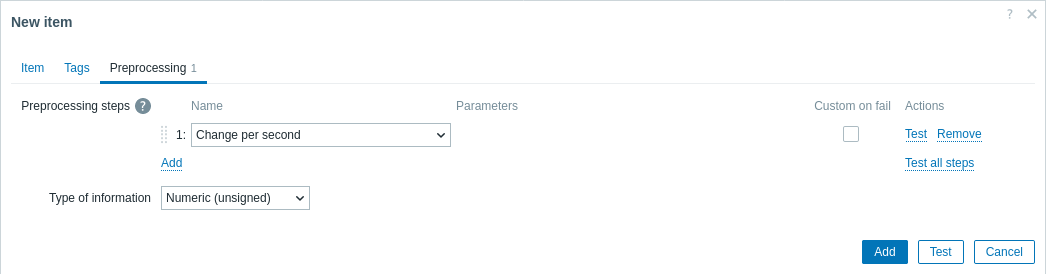
- Preprocessing (if needed): if the item returns a cumulative counter (such as interface traffic), navigate to the Preprocessing tab, and add a preprocessing step like "Change per second" to calculate the rate.
To retrieve multiple values in one SNMP transaction, you can specify several OIDs using the syntax walk[OID1,OID2,...].
Translating OIDs between Numeric and MIB Names
When working with SNMP, you might need to convert between numeric OIDs and their corresponding MIB names. This translation helps in identifying and troubleshooting metrics more easily.
- Translating a MIB name to a numeric OID: use the
snmptranslatecommand with the-Onoption. For example, to translate the MIB nameIF-MIB::ifHCInOctets.3to its numeric OID, run:
snmptranslate -On IF-MIB::ifHCInOctets.3This command might output:
.1.3.6.1.2.1.31.1.1.1.6.3- Translating a numeric OID to its MIB name: use the
snmptranslatecommand with the-IR(or-m ALL) option to reverse the translation. For example, to translate the numeric OID.1.3.6.1.2.1.31.1.1.1.6.3back to its MIB name, run:
snmptranslate -IR -On .1.3.6.1.2.1.31.1.1.1.6.3This command might output:
IF-MIB::ifHCInOctets.3Set up problem alerts
This guide provides basic configuration steps for sending email alerts.
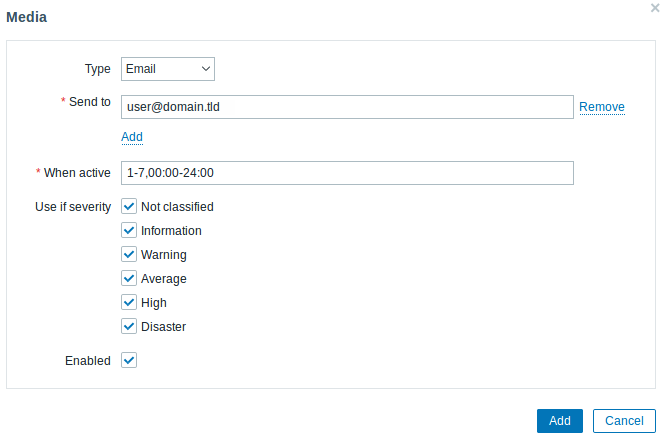
1. Navigate to User settings > Profile, switch to the Media tab and add your email.
2. Follow the guide for Receiving a problem notification.
Next time, when Zabbix detects a problem, you should receive an alert via email.
Test your configuration
To ensure that Zabbix correctly detects network performance issues, simulate a real problem by increasing the ICMP ping response time threshold.
1. Open your "Cisco Router" host configuration in Zabbix.
2. Navigate to the Macros tab and select Inherited and host macros.
3. Locate the {$ICMP_RESPONSE_TIME_WARN} macro (or a similar response time threshold macro).
4. Set a very low value (e.g., 0.001) to trigger an alert when the ping response exceeds this value.
5. Click Update to apply the changes.
6. Wait a few moments for Zabbix to detect the simulated issue.
7. Navigate to Monitoring > Problems to verify that an alert appears (e.g., "High ICMP ping response time").
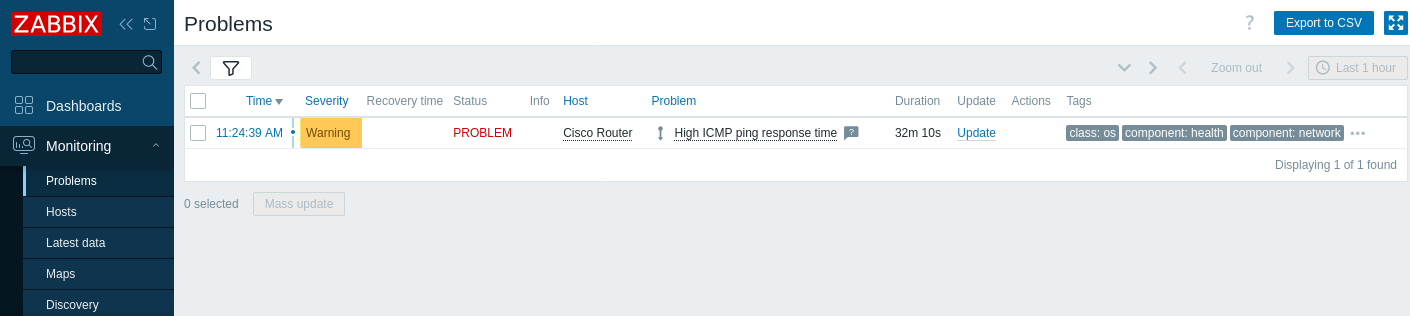
If alerts are configured, you should also receive a problem alert.
8. Revert the macro value to its original setting and click Update to save the changes.
9. Confirm that the problem is resolved and disappears from the Problems section.
Troubleshooting SNMP Monitoring
If you notice that the SNMP icon in the Zabbix frontend appears RED or no data is collected, try the following steps:
1. Check SNMP connectivity.
For SNMPv2 run the following command from your Zabbix server:
snmpwalk -v 2c -c <community_string> <device_IP> .This command verifies that the device responds to SNMP queries.
For SNMPv3, include the appropriate SNMPv3 credentials:
snmpwalk -v3 -u <your_user> -l authPriv -a MD5 -A <auth_password> -x AES -X <priv_password> <device_IP> .This verifies that SNMPv3 credentials are correct and the device is responding securely.
2. Ensure that MIB files are installed and enabled as described in the prerequisites. To ensure that, following command must not give error when you query a network device:
snmpwalk -v 2c -c <your_community_string> <device_IP> ifInOctetsThis should return translated OIDs without errors.
3. Confirm that the SNMP version and credentials configured in Zabbix match those set on your device. For instance, review the SNMP settings in the Zabbix host configuration and verify them against your device's configuration. On a Cisco device, you might check the SNMP settings by running:
show running-config | include snmpThis ensures that the community string (for SNMPv2) or SNMPv3 user details are correct.
4. Verify that SNMP is correctly enabled on your network device. On a Cisco router, log in to the console and run:
show running-config | include snmpThis command displays the active SNMP configuration and helps confirm that SNMP is properly configured.
5. Ensure that no firewalls or network issues are blocking SNMP traffic (typically on port 161) between the Zabbix server and the device. You can test connectivity using:
nc -zv <device_IP> 161
nc -zv checks if port 161 is open and listening on the device.
Additionally, if you are using UFW on Ubuntu, check the firewall status:
sudo ufw statusOr, for iptables:
sudo iptables -L -n6. Review the Zabbix server log files for any SNMP-related errors to help pinpoint the issue:
tail -f /tmp/zabbix_server.logtail -f allows you to monitor log updates in real time.
See also:
- Creating an item - learn how to add additional metrics.
- SNMP agent - additional information on SNMP monitoring with Zabbix.
- Standardized templates for network devices - information on available SNMP templates.
- Discovery of SNMP OIDs - additional information on SNMP discovery on a switch.
- Configuring a network discovery rule - additional information on how to configure a network discovery rule used by Zabbix to discover hosts and services.