
4 Top 100 triggers
Overview
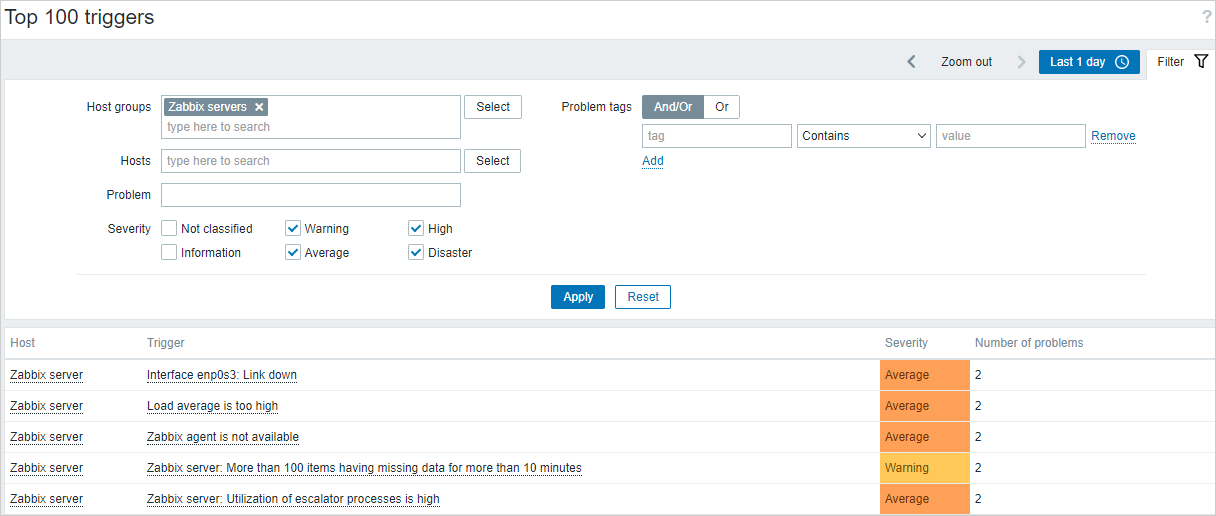
In Reports → Top 100 triggers, you can see the triggers with the highest number of problems detected during the selected period.
Both host and trigger column entries are links that offer some useful options:
- for host - clicking on the host name brings up the host menu
- for trigger - clicking on the trigger name brings up links to the latest events, simple graph for each trigger item, and the configuration forms of the trigger itself and each trigger item
Using filter
You may use the filter to display triggers by host group, host, problem name, tags, or trigger severity. Specifying a parent host group implicitly selects all nested host groups. For better search performance, data is searched with macros unresolved.
The filter is located below the Top 100 triggers section name. It can be opened and collapsed by clicking on the Filter tab on the right.
Time period selector
The time period selector next to the filter allows to select often required periods with one mouse click. For more information, see Time period and host selectors.